
How to collect data in the system?
This guide provides essential instructions for effectively collecting and managing data within a system, ensuring accurate representation in graphs and reports. It covers various data collection methods, including frequency, percentage, and intensity, allowing users to tailor their approach based on specific behaviors or skills. By following this guide, users can enhance their data accuracy and insights, ultimately improving decision-making and outcomes in their practice.
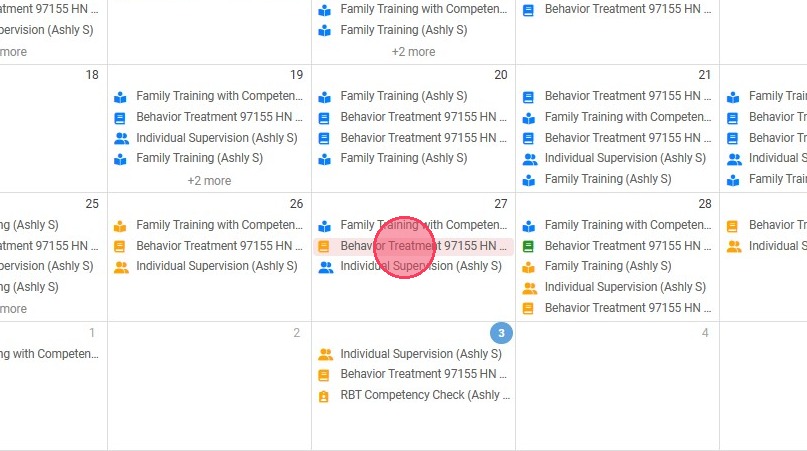
1. Access the scheduled session.
1. After creating the session, click on the scheduled day to edit the note you wish to modify.
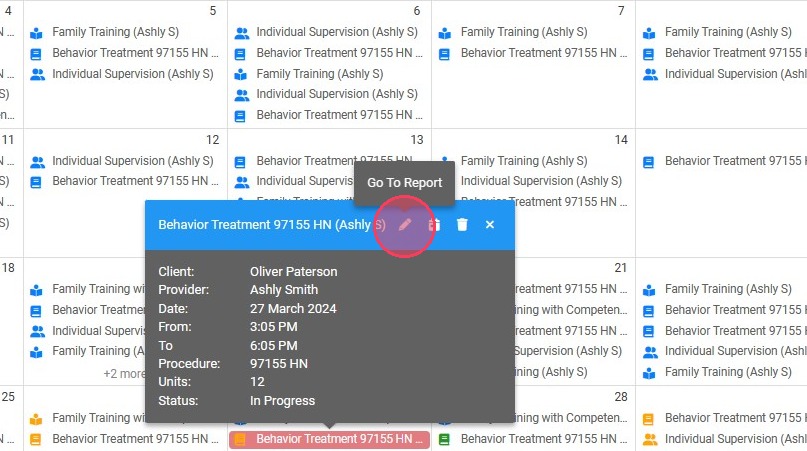
2. Access the session note through the "Go To Report" icon.
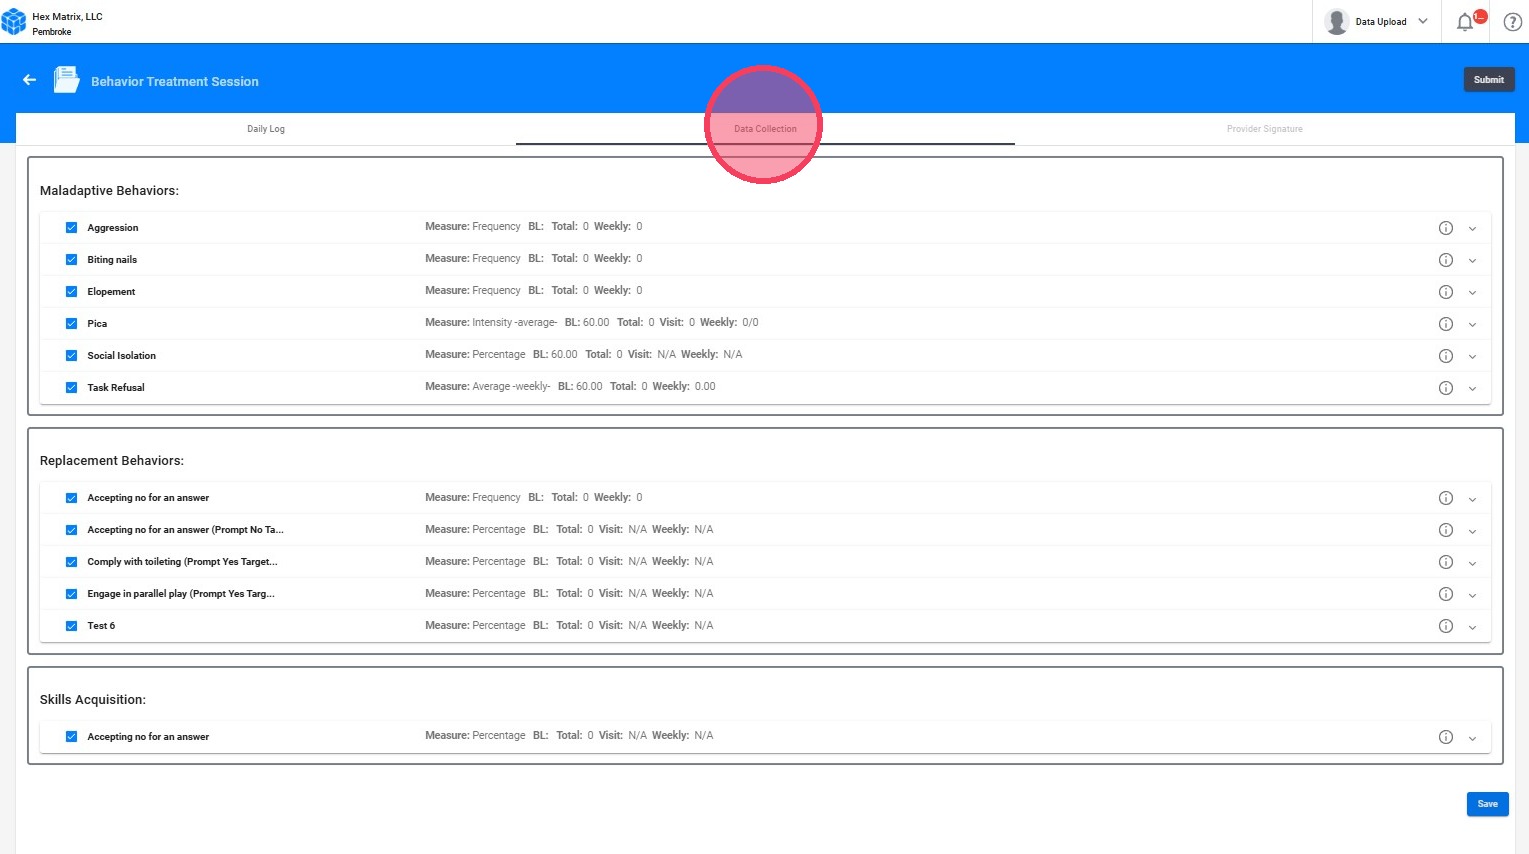
2. Access the data collection tab.
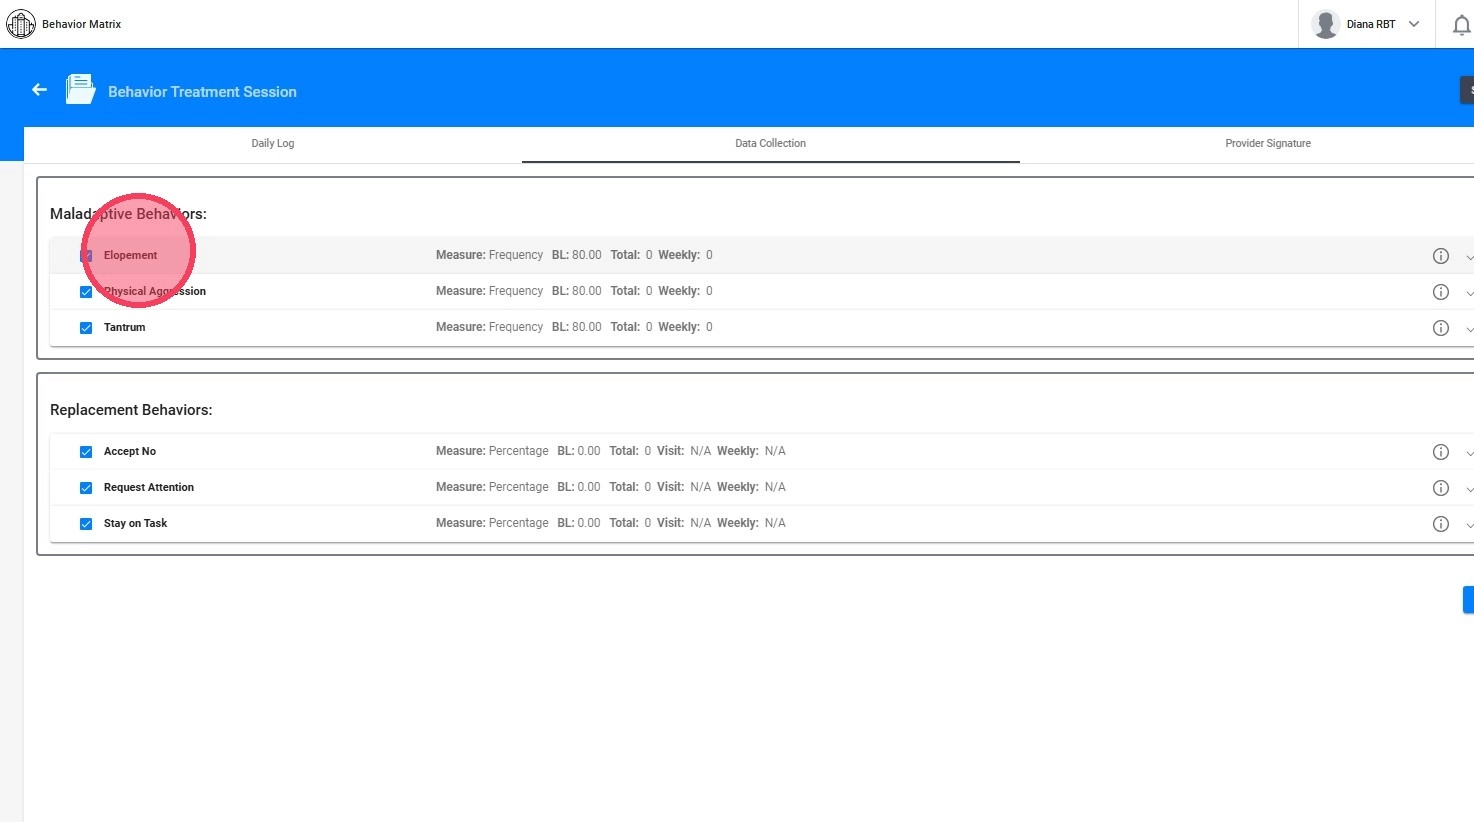
3. When collecting data for behaviors, replacements, or skills, the way you select and manage these entries affects how they are represented in the system’s graphs.
4. If you do not select a specific behavior, replacement, or skill for data collection, that item will not appear in the generated graph.
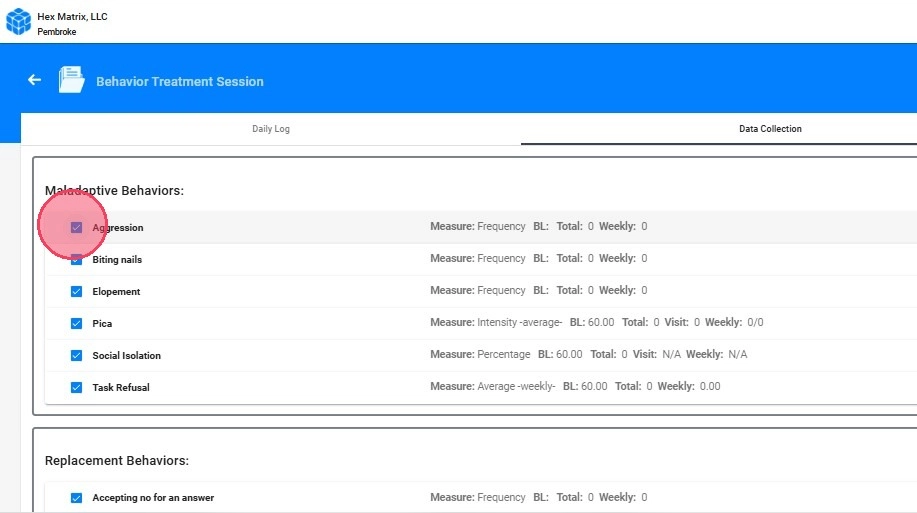
5. If you choose to mark a behavior, replacement, or skill for data collection but do not input any data for it, the system will automatically record a value of 0 for that session.
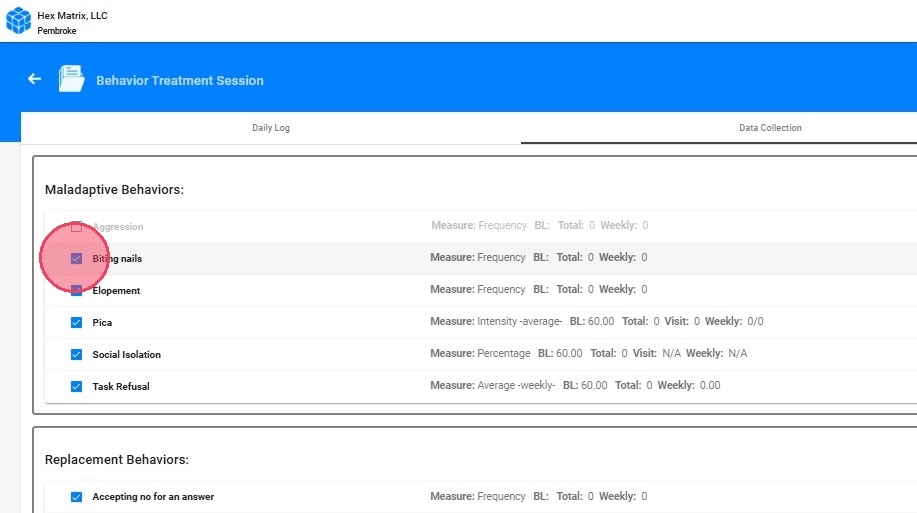
The note format depends on your agency’s configuration. If you do not see checkboxes in your Data Collection to select or deselect maladaptive behaviors or programs, please navigate to the Daily Log tab.
From there, locate the section titled Target Behaviors, Replacements and Skills Observed. In this section, simply select the Behaviors, Replacements, or Skills that were observed during the session to ensure they are properly recorded.

3. Access the observed Behavior, Replacement, or Skill.
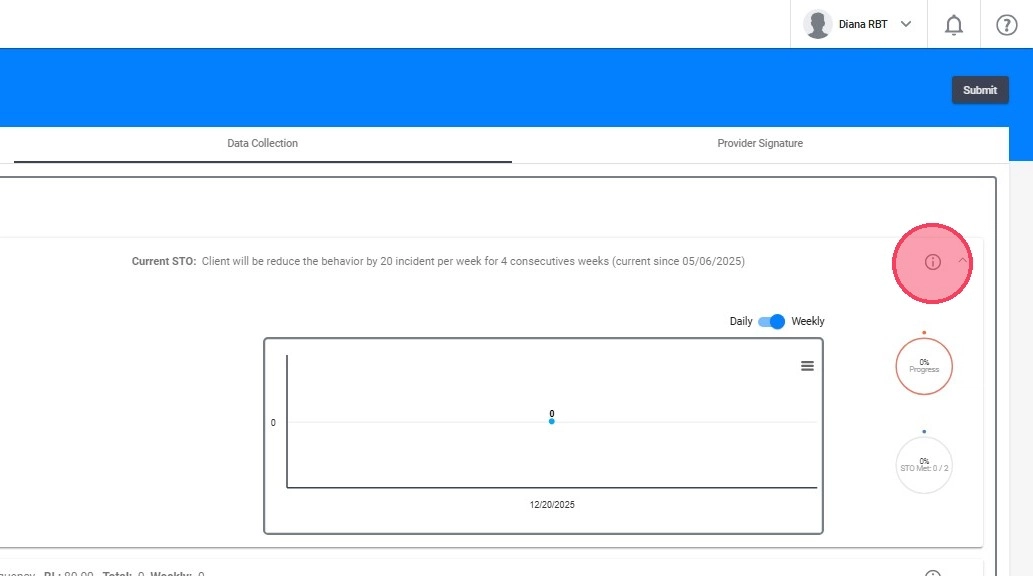
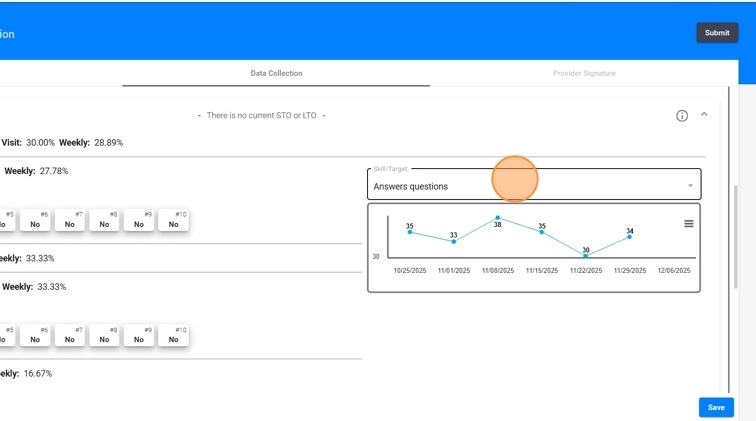
6. By clicking on the desired behavior, replacement, or skill, you can view basic information about it.
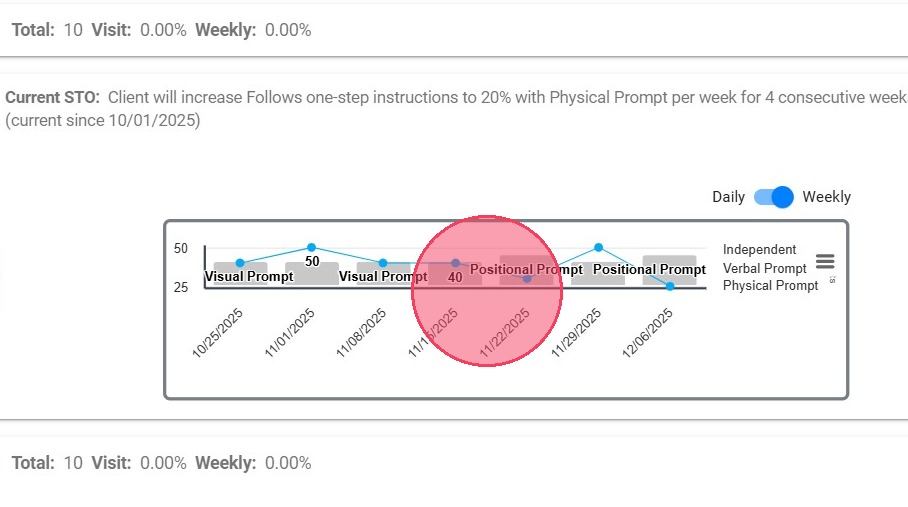
- The live data collection graph will allow you to view graph updates in real time.
- Current STO: Ongoing Short-Term Objective for the chosen behavior, replacement, or skill.
- Measure: Quantification of the chosen behavior, replacement, or skill.
- Baseline: Initial data point for the chosen behavior, replacement, or skill.
- Total: Cumulative data gathered during the session.
- Weekly: Data compiled over the week.
- Live Data Collection graph: This graph displays changes in real-time as data is recorded.
7. From the information icon on the right side of each behavior or replacement skill, you can view clinical details without leaving the note.
- Behaviors include: Topography, Functions and Interventions
- Replacement Skills include: Procedure, Definition, Barriers & Functions
4. Collect data
The data collection process depends on the measurement of each selected behavior, replacement, or skill.
4.1. Frequency
8. To collect data on frequency, you should add the number of occurrences.
You can add and subtract occurrences using the "+" and "-" symbols, or type the number directly.

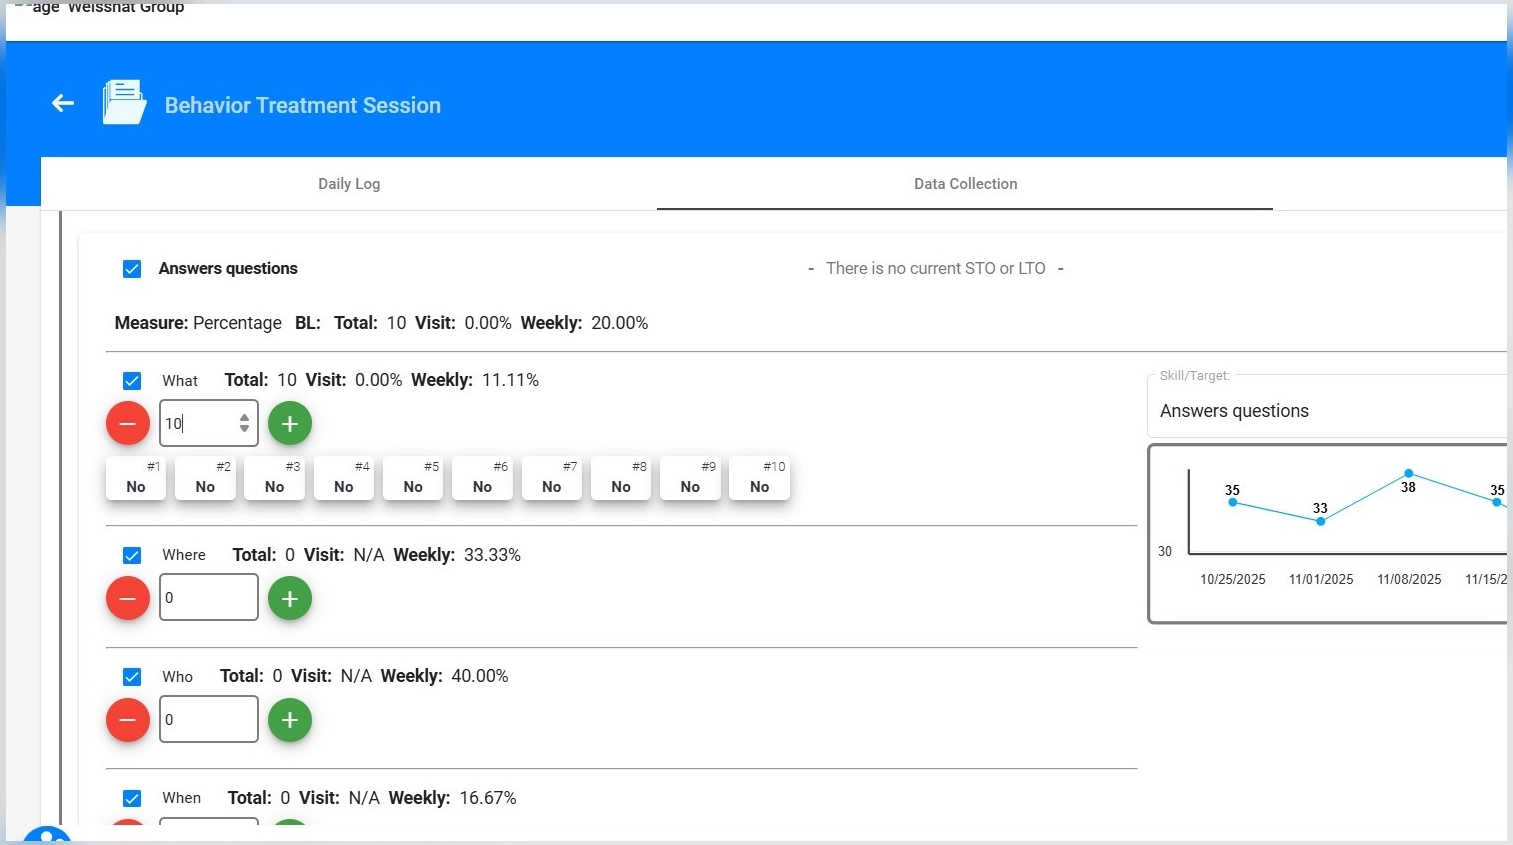
4.2. Percentage
9. To collect data as a percentage, you should first add the number of attempts, and then define which of those attempts were successful or not.
- The number of attempts is added in the same way as occurrences.
- To define whether an attempt was successful (YES) or not (NO), simply click on the attempt, and it will toggle between YES and NO.

4.3. Intervals
10. To collect data in intervals, you should first add the number of intervals, and then define in which ones the behavior occurred or not, similar to percentage.
- The number of intervals is added in the same way as attempts.
- To define whether the behavior occurred (YES) or not (NO) in a particular interval, simply click on the interval, and it will toggle between YES and NO.

4.4. Intensity
11. To collect data on intensity, you must first add the interval, and then define the intensity of each one.
- The number of intervals is added in the same way as attempts.
- To define the intensity of the interval, simply click on the interval until it reaches the correct intensity.

4.5. Duration
12. To collect data in time, whether in seconds or minutes, you should first add the number of occurrences, and then define the time for each of those occurrences.
- The number of occurrences is added in the same way.
- To define the time for each occurrence, you can use the symbol or enter it manually.

Options: Time -seconds- / Time -minutes- / Time (sum) -min-
Time -seconds- : This measure records the duration in seconds. It is useful for precise measurement of short-duration behaviors.
Example: if a behavior occurs 5 times with durations of 10s, 12s, 8s, 15s and 11s, the average duration is (10 + 12 + 8 + 15 + 11) / 5 = 11.2 seconds.
Time -minutes-: the duration is recorded in minutes and the average duration is calculated.
Example: if a behavior occurs 3 times with durations of 5, 7 and 6 minutes, the average duration is (5 + 7 + 6) / 3 = 6 minutes.
Time (sum) -min-: Measures the total accumulated duration of a behavior in minutes across multiple instances throughout the session.
Example: if a behavior occurs with durations of 10 , 15 and 20 minutes over a session, the total time is 10 + 15 + 20 = 45 minutes.
4.6. Rate -hours-
13. To collect data in rate according to the hours of visit duration, you only need to collect the number of occurrences during the session. In this case, the rate will be calculated based on the number of incidences over the duration of the session.

4.7. Task Analysis
14. For task analysis data collection, the tasks defined in the client’s profile will automatically be available within the program.
- To begin collecting data, click the “+” button to add a new trial.
- Each trial is automatically generated with all the steps included in the task analysis.
- Within each trial, you can score performance for each individual step by marking whether the step was completed correctly (Yes) or not (No).
All steps will be listed in every trial, allowing you to record performance step by step. As trials and steps are scored, totals update automatically. The system consolidates all data to calculate overall program results in real time.

The live data collection graph will display the program’s graph by default, but you can switch to view a specific task graph when needed.
This provides clearer insight into which tasks are improving and supports more accurate reporting and analysis.

4.8. Additional Data Collection Options: Targets and Prompt Levels
15. - Prompt Levels
If prompt-level data collection is enabled for the target, select the prompt level used when entering trials.
Use the prompt selector icon to choose a level for each trial or select “Apply to All Trials” to apply the same prompt to all trials.
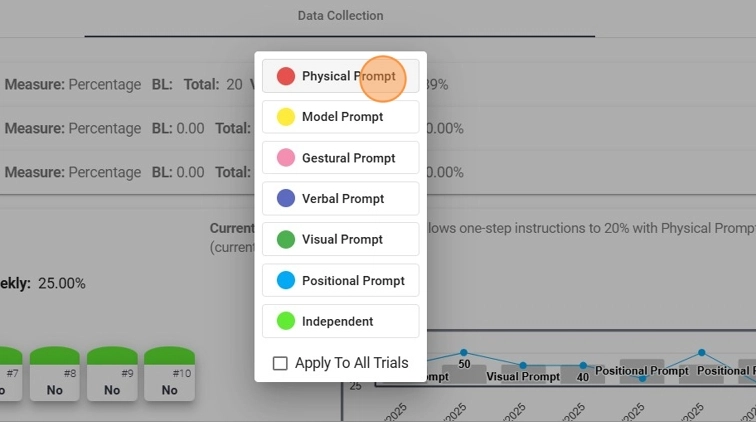
16. The graph updates automatically to reflect prompt usage.
For additional guidance, refer to How to Collect Prompt-Level Data.
17. - Targets
If a replacement or skill includes targets, record data for each target individually. Each target appears as a separate item where you enter trials and mark responses as Yes/No.
The system updates trial counts and percentages in real time and automatically combines all target data into the program’s overall results.
The live graph shows the program by default, but you can switch to a specific target view for clearer insight into individual target progress.
18. The live data collection graph will display the program’s graph by default, but you can switch to view a specific target graph when needed.
For additional guidance, refer to How to Collect Data for Targets
5. Save the changes
19. It's important to save the changes before exiting the note.
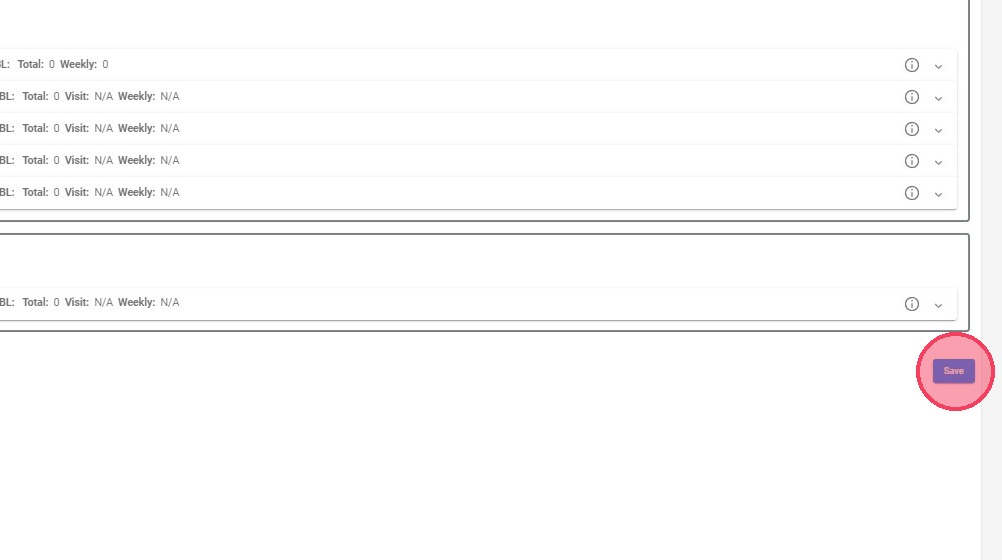
You can edit the collected information until the note reaches the 'Completed' status.