Building and Managing Custom Reports
This guide shows how to build, customize, and reuse targeted reports in ABA Matrix so you can quickly surface and act on specific clinical, billing, or administrative needs. It explains picking data sources, selecting columns, applying filters and sorts, adding summary calculations, and exporting or adding reports to your Dashboard. Follow it to save time, reduce manual calculations, and share repeatable, agency-specific reports.
The Custom Reports feature allows you to create personalized reports using the information available in ABA Matrix. You can choose what information to include, apply filters, organize your results, and add calculations based on your reporting needs.
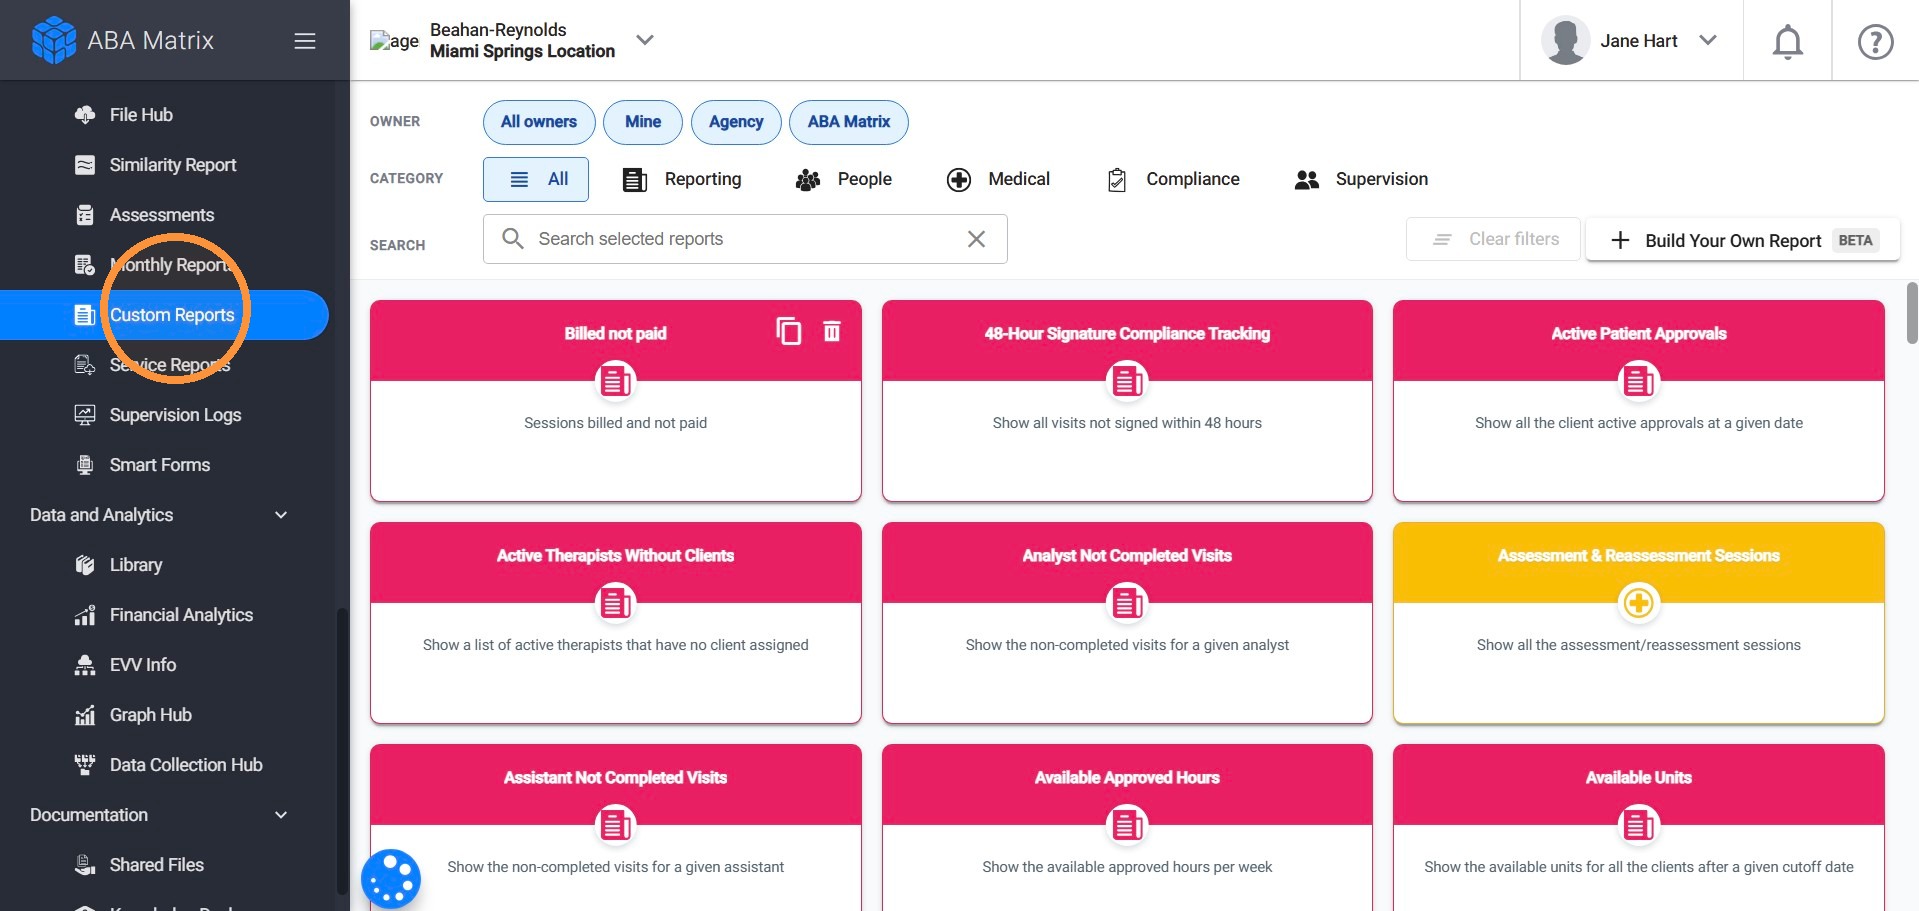
1. Navigate to Report Hub > Custom Reports to access the Report Catalog.
Here, you can explore a variety of preconfigured reports or create your own based on your agency's needs. You can:
- Browse available reports organized by category, including Reporting, People, Medical, Compliance, and Supervision.
- Filter reports by owner using All Owners, Mine, Agency, or ABA Matrix.
- Use the search bar to quickly find a specific report.
- Select a report to view its information.
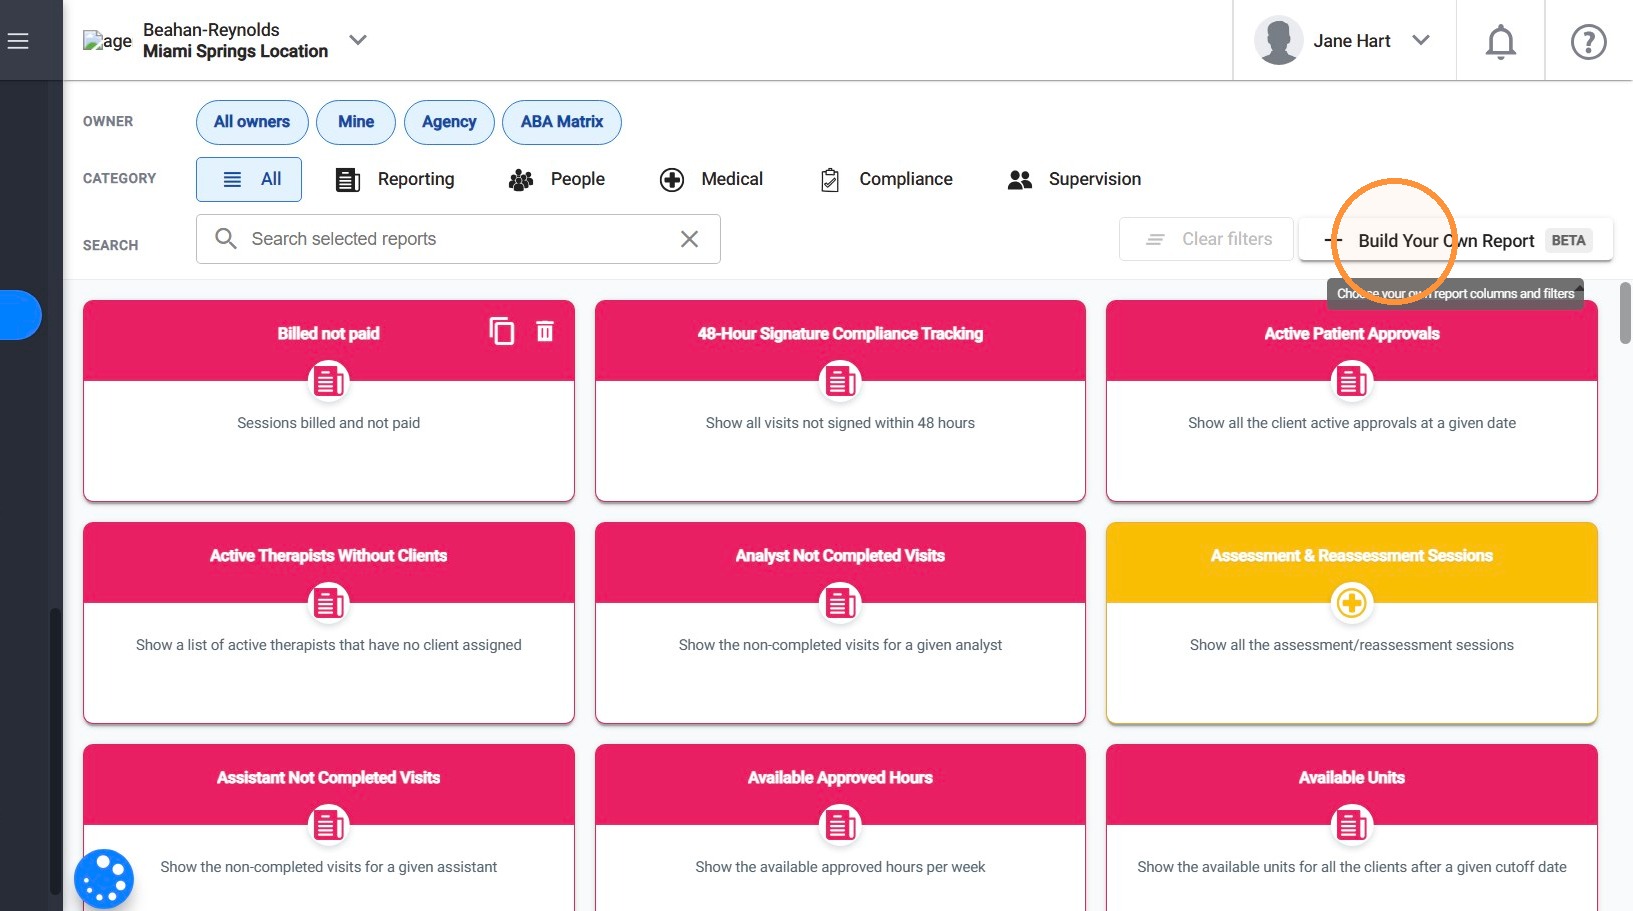
- Click + Build Your Own Report to create a personalized report from scratch.
1. Create a New Custom Report
2. Click + Build Your Own Report
The Build a report window will open and guide you through six steps:
- Report Setup: Select the type of information you want to include in your report.
- Columns: Choose which fields and details you want to display.
- Filters: Narrow down your results by selecting specific conditions, such as dates, clients, or statuses.
- Sorting: Organize your results in a specific order, such as alphabetically or by date.
- Aggregates: Add calculations, such as totals, averages, or record counts, to summarize your data.
- Generate: Review your selections and generate your customized report.
Let's build a report together as an example! We'll create a Behavior Treatment Session report to identify sessions that have been billed but have not yet been paid by insurance.
You can follow these same steps to create other custom reports based on your agency's needs.
1.1 Select the Report Type
3. Choose the type of information you want to include in your report.
Available report types include client and staff information, authorizations, behavior treatment sessions, assessments and reassessments, supervision, family training, clinical programs and goals, EVV records, documents, and other administrative and clinical information.
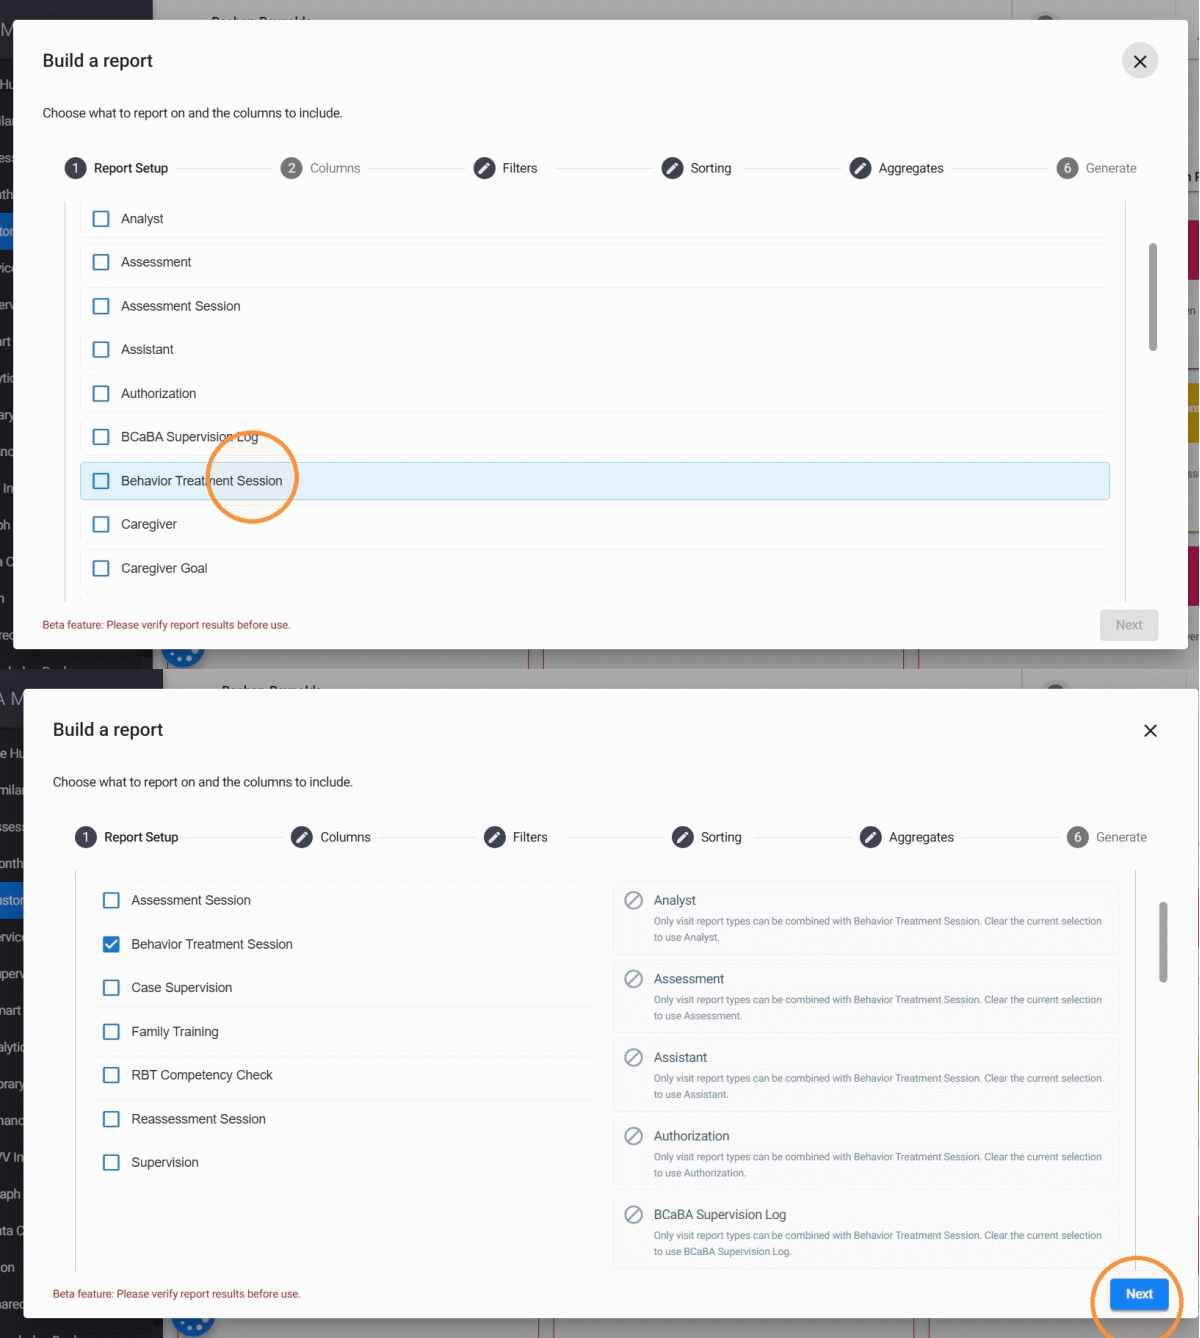
For this example, we can select Behavior Treatment Session to create a report that helps us review sessions that have been billed but have not yet been paid by insurance.
1.2 Select the columns to include
4. The Columns step allows you to choose which information will appear in your report. The available columns depend on the report type selected in the previous step. Each report type provides different fields based on the information available in ABA Matrix.
For example, a staff report may include employee details, while a session report may include visit dates, procedures, units, and billing information.
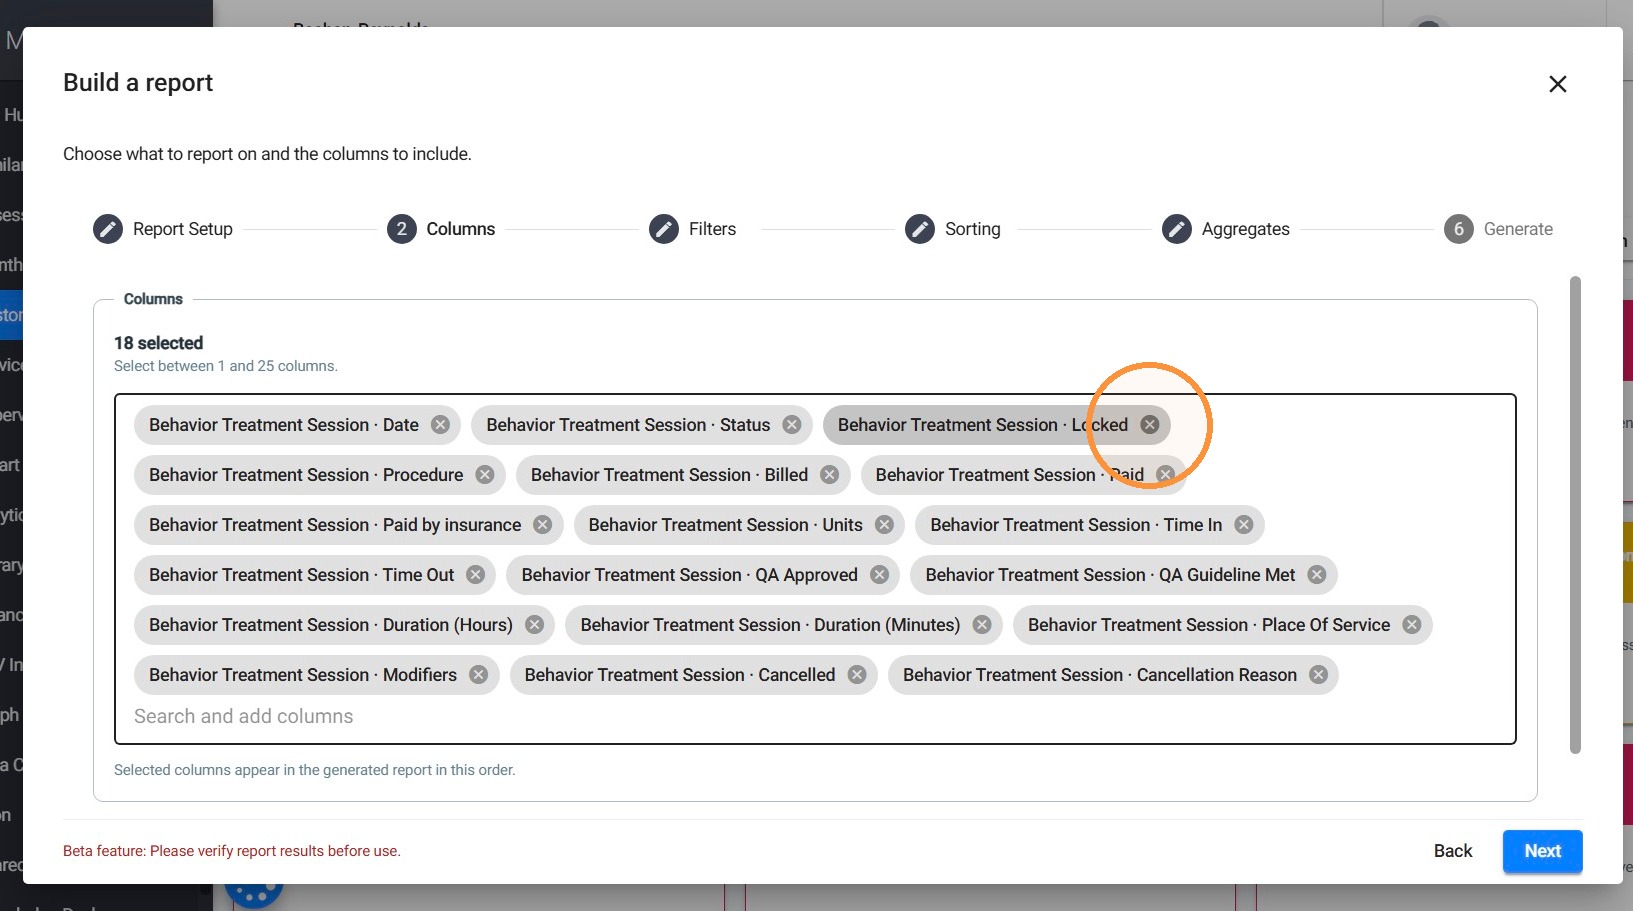
5. To select your columns:
- Review the columns automatically selected for your report.
- Use Search and add columns to find additional information you want to display.
- Select the columns you want to include.
- Click the X next to any selected column to remove it.
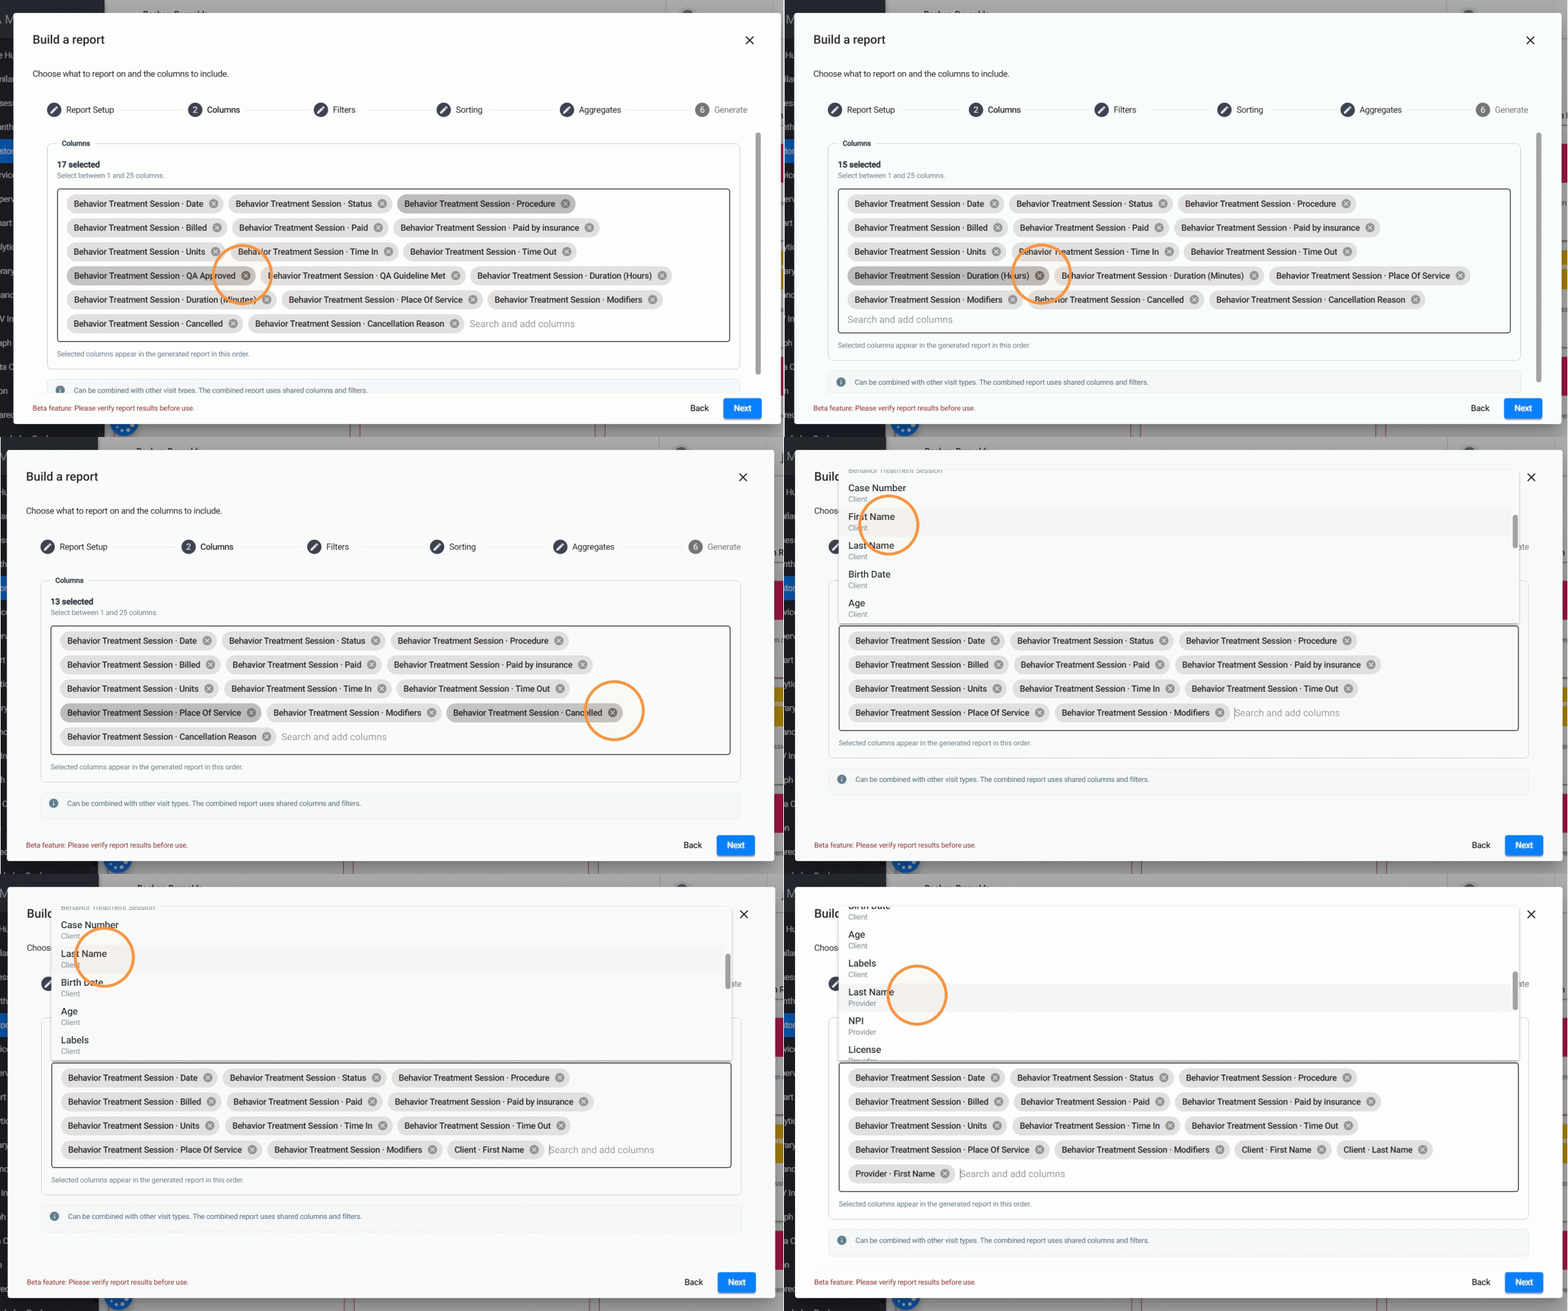
For this example, we can select columns such as Billed, Paid by Insurance, and Paid to review the billing and payroll status of each session. We can also include information such as session date and time, status, insurance, procedure, units, client, and provider details to make the report more informative.
1.3 Apply Filters to your Report
6. The Filters step allows you to narrow down your results and include only the records you want to review. Available filters depend on the report type you selected. Each report provides filtering options related to the information it contains.
For example, depending on your report type, you may be able to filter information by clients, providers, dates, procedures, statuses, or other available conditions.
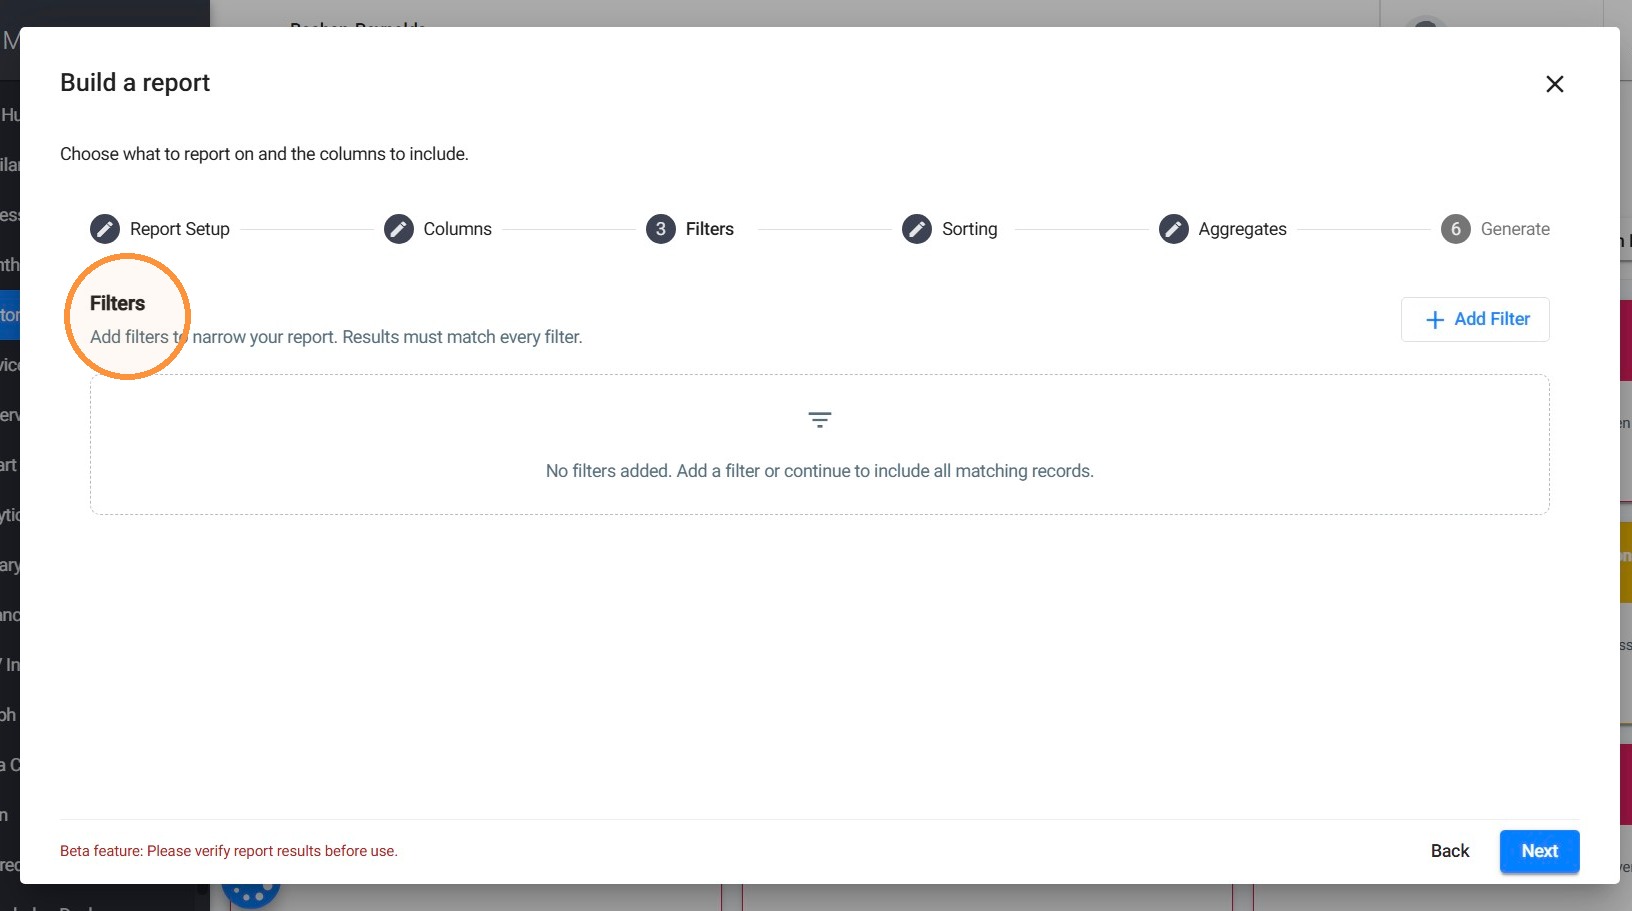
7. Add Filters
- Click + Add Filter.
- Use the search field to find the filter you want to apply.
- Select the desired filter.
- Choose the values or conditions you want to include.
- Repeat these steps to add additional filters.
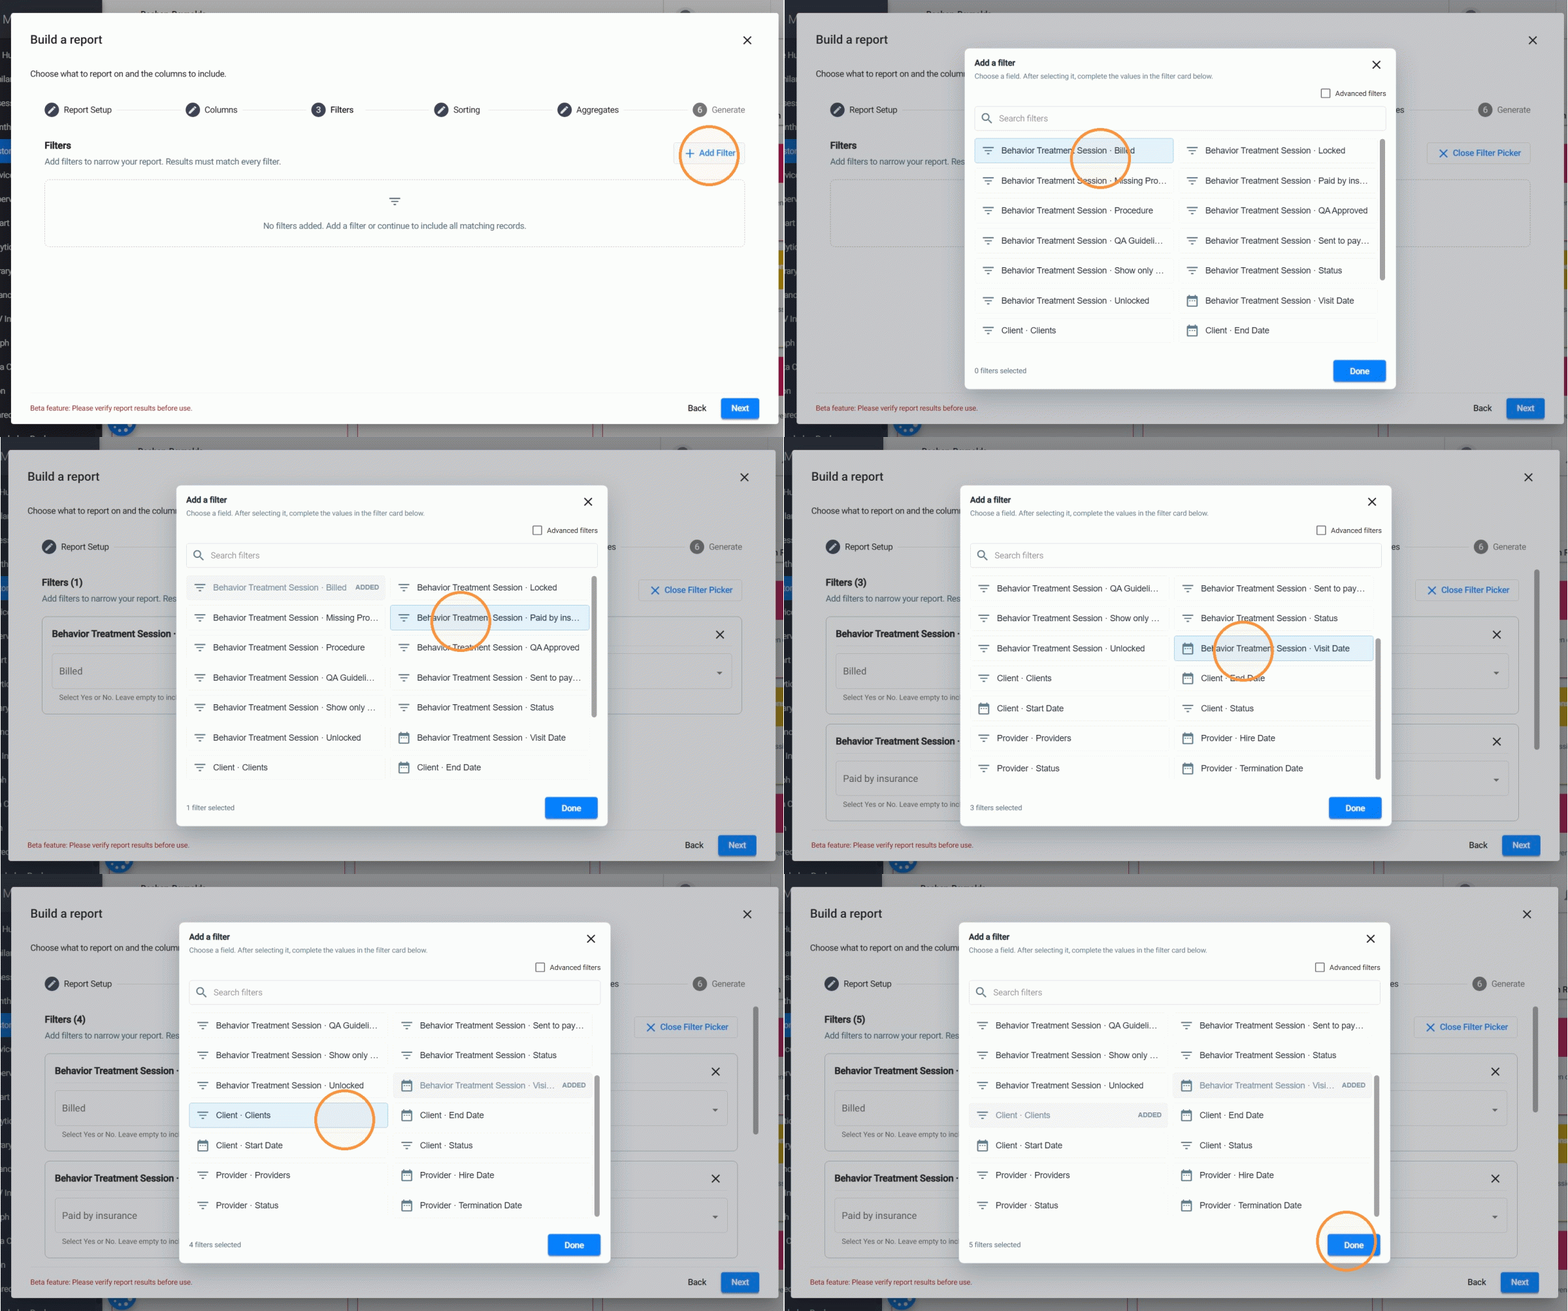
8. Some filters allow you to select Yes or No, while others provide dates, or dropdown menus, depending on the selected field.
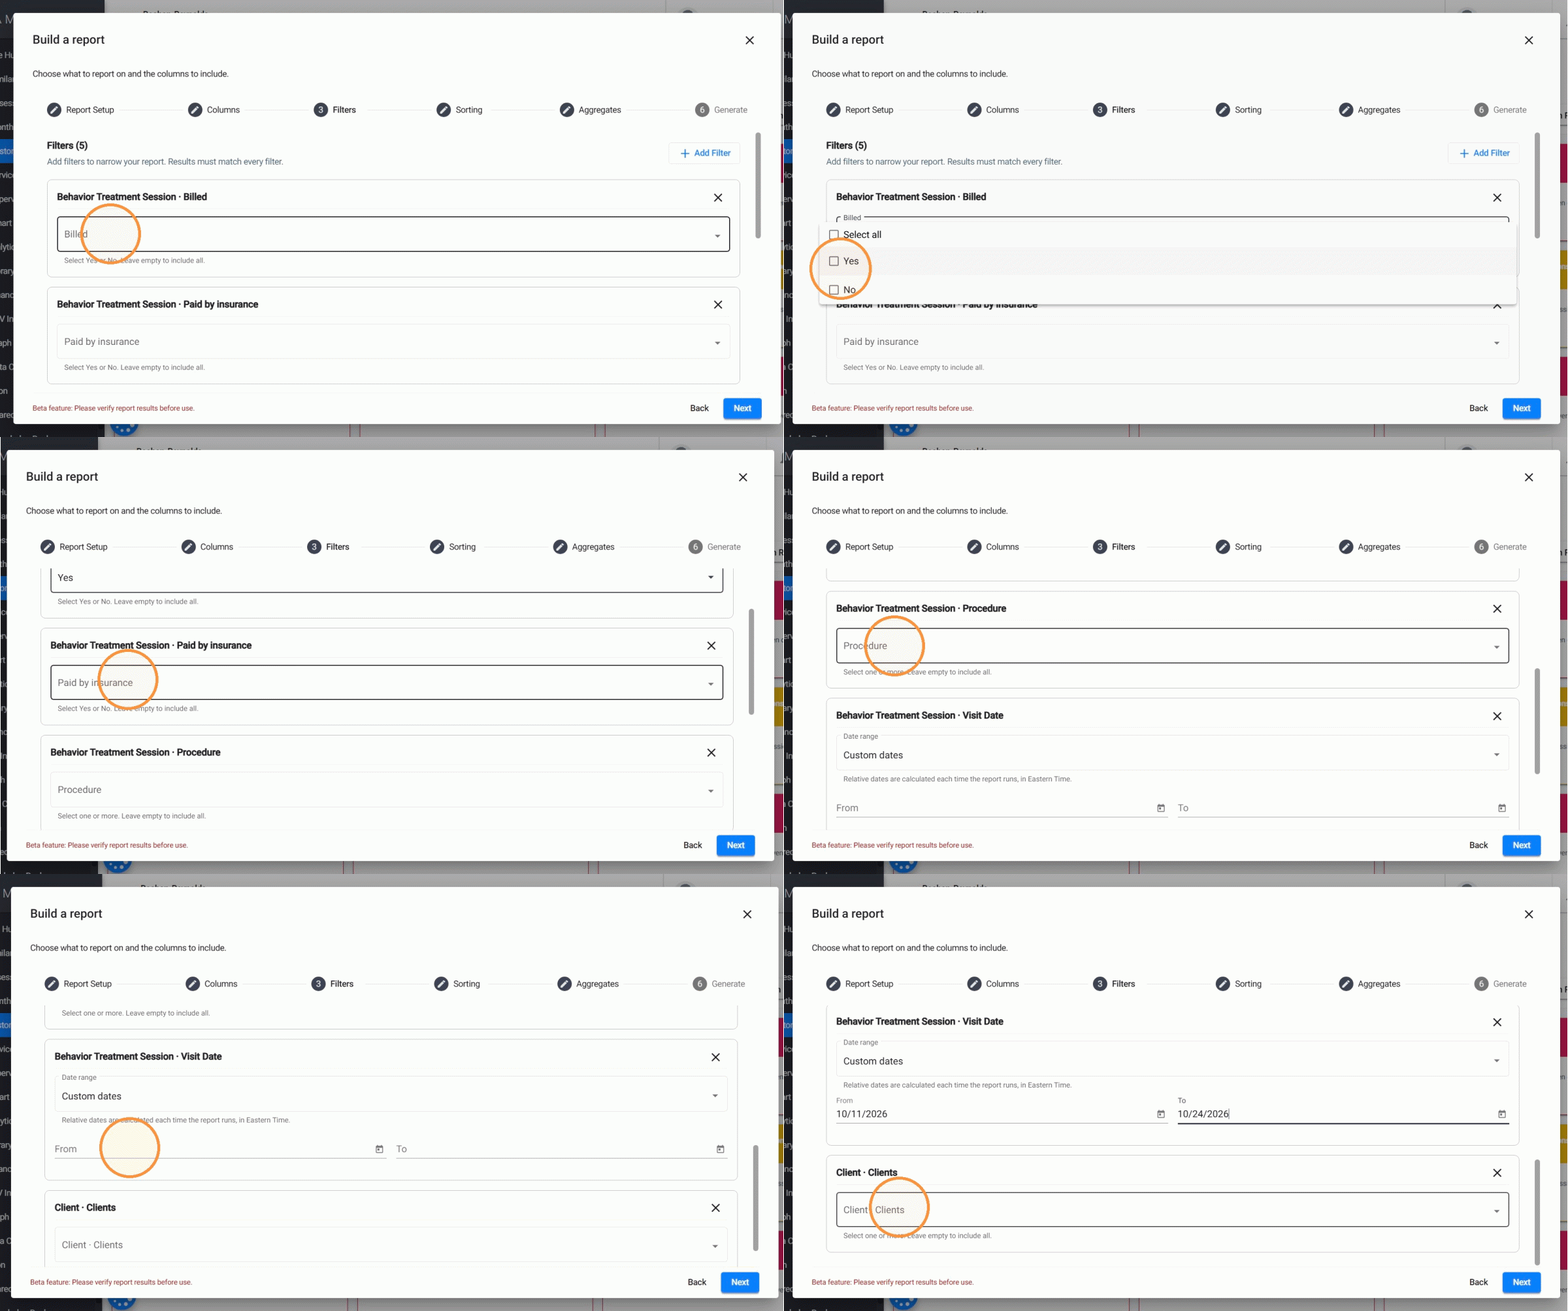
For this example, we can add the following filters to include only Behavior Treatment Sessions that have been billed but have not yet been paid by insurance:
- Behavior Treatment Session · Billed: Yes
- Behavior Treatment Session · Paid by insurance: No
- Behavior Treatment Session · Visit Date: Select the period we want to review.
We could also add filters for Clients, Procedures, or Insurance to narrow down the results to specific clients, procedure codes, or insurance payers.
Note: Filters are optional. If you do not add any, the report will include all matching records for the selected report type.
1.4 Organize your results with Sorting
9. The Sorting step allows you to choose how the information in your report will be organized.
The available sorting options are based on the columns you selected. This means you can organize your results using the information included in your report.
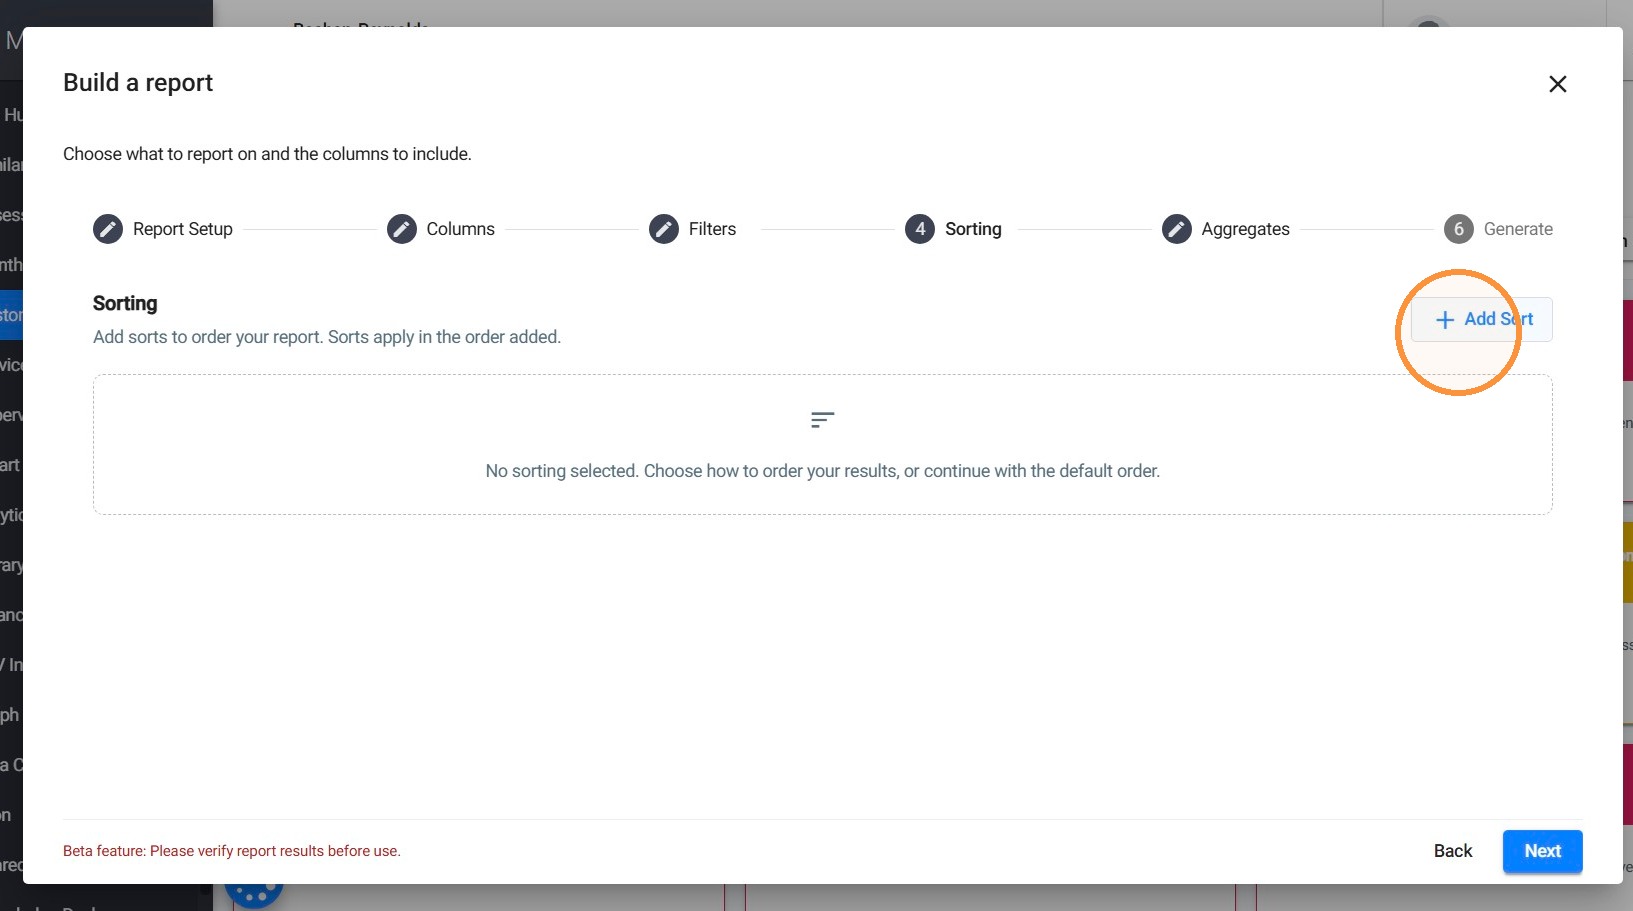
10. Add Sorting
- Click + Add Sort.
- Select the column you want to use to organize the results.
- Choose the sorting direction:
- Ascending: A–Z, oldest to newest, or lowest to highest.
- Descending: Z–A, newest to oldest, or highest to lowest.
- Add additional sorting options if needed.
- Click Done.
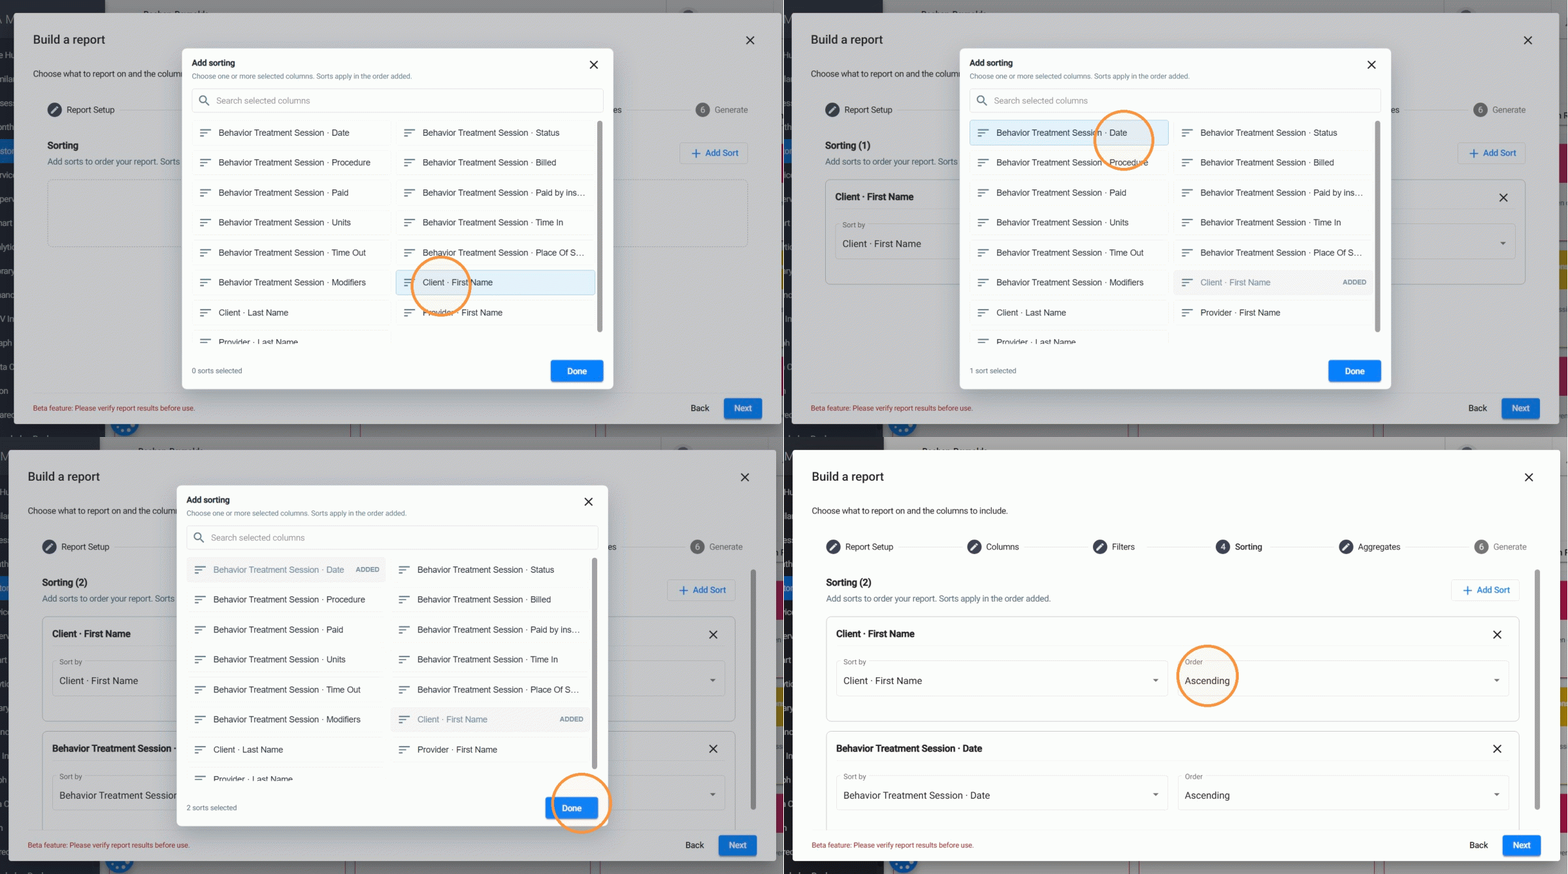
For this example, we can organize the billed sessions that have not been paid by insurance using:
- Sort 1: Client · First Name — Ascending
- Sort 2: Behavior Treatment Session · Date — Ascending
This would organize the sessions alphabetically by client first name and then by session date, starting with the oldest. This makes it easier to review which billed sessions are still unpaid for each client.
Note: Sorting is optional. If you don't select any sorting options, the report will use the default order.
1.5 Add Aggregates (Totals and Calculations)
11. The Aggregates step allows you to include summary calculations in your report.
These calculations help you quickly review totals, averages, or other important values without calculating them manually. The same types of aggregate calculations are available across report types. However, the fields available for each calculation depend on the information in your report.
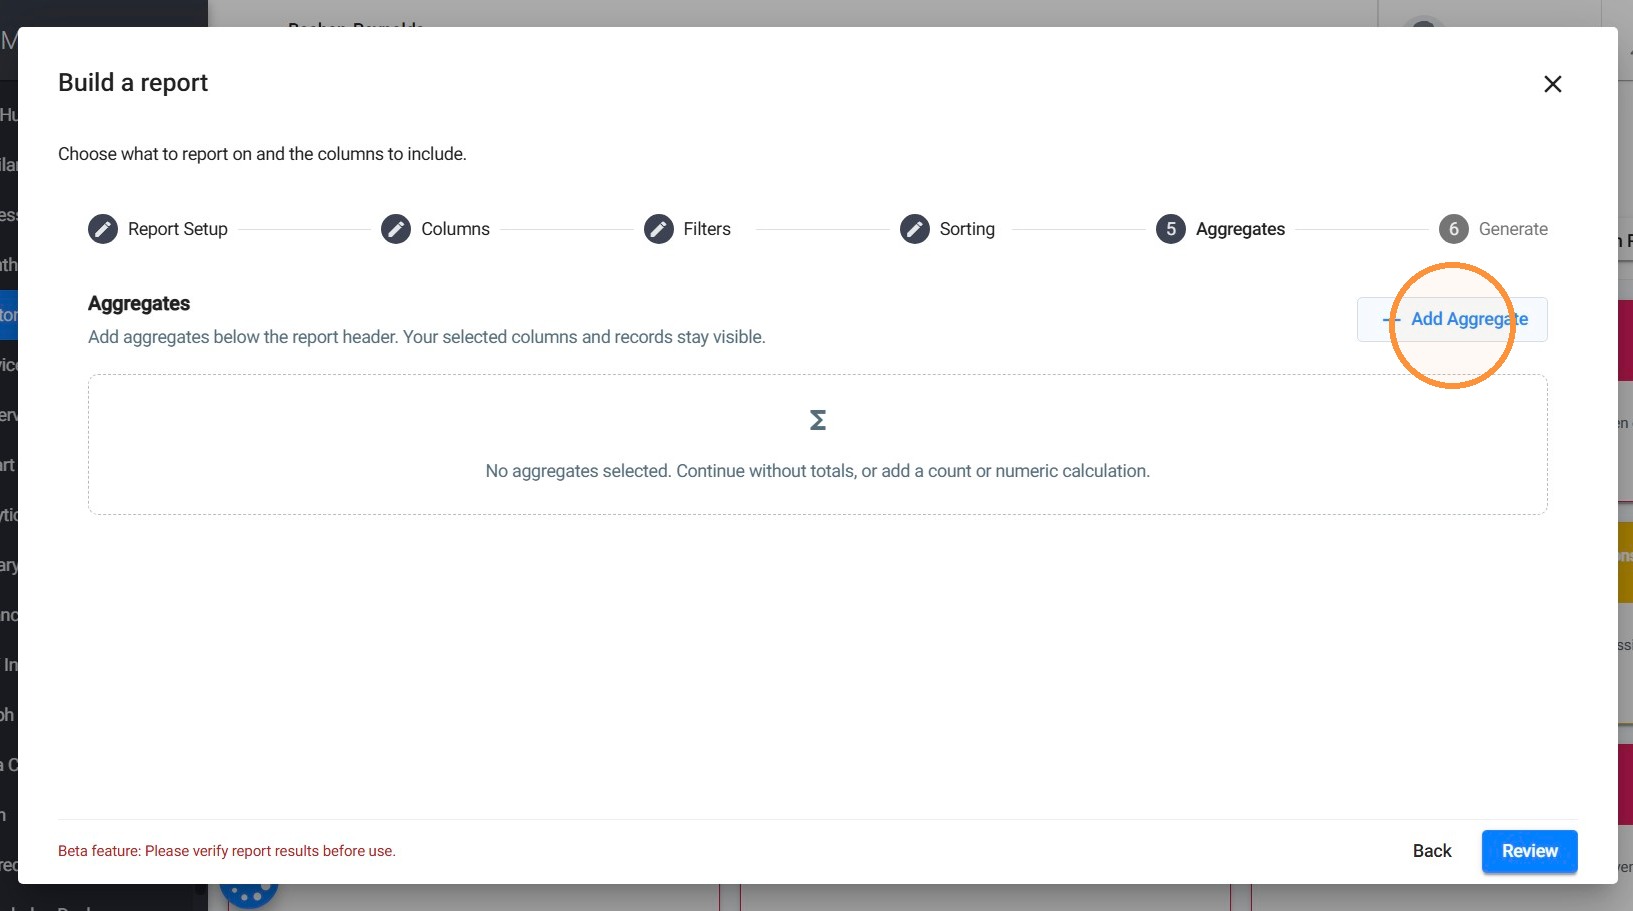
12. Select an Aggregate
- Click + Add Aggregate.
- Select the type of calculation you want to include.
- Choose the corresponding field, if required.
- Click Done.
Available calculations:
- Record Count: Counts the total number of records included
- Sum: Adds together the values of a numeric field.
- Average: Calculates the average value of a numeric field.
- Minimum: Displays the lowest value of a selected field.
- Maximum: Displays the highest value of a selected field.
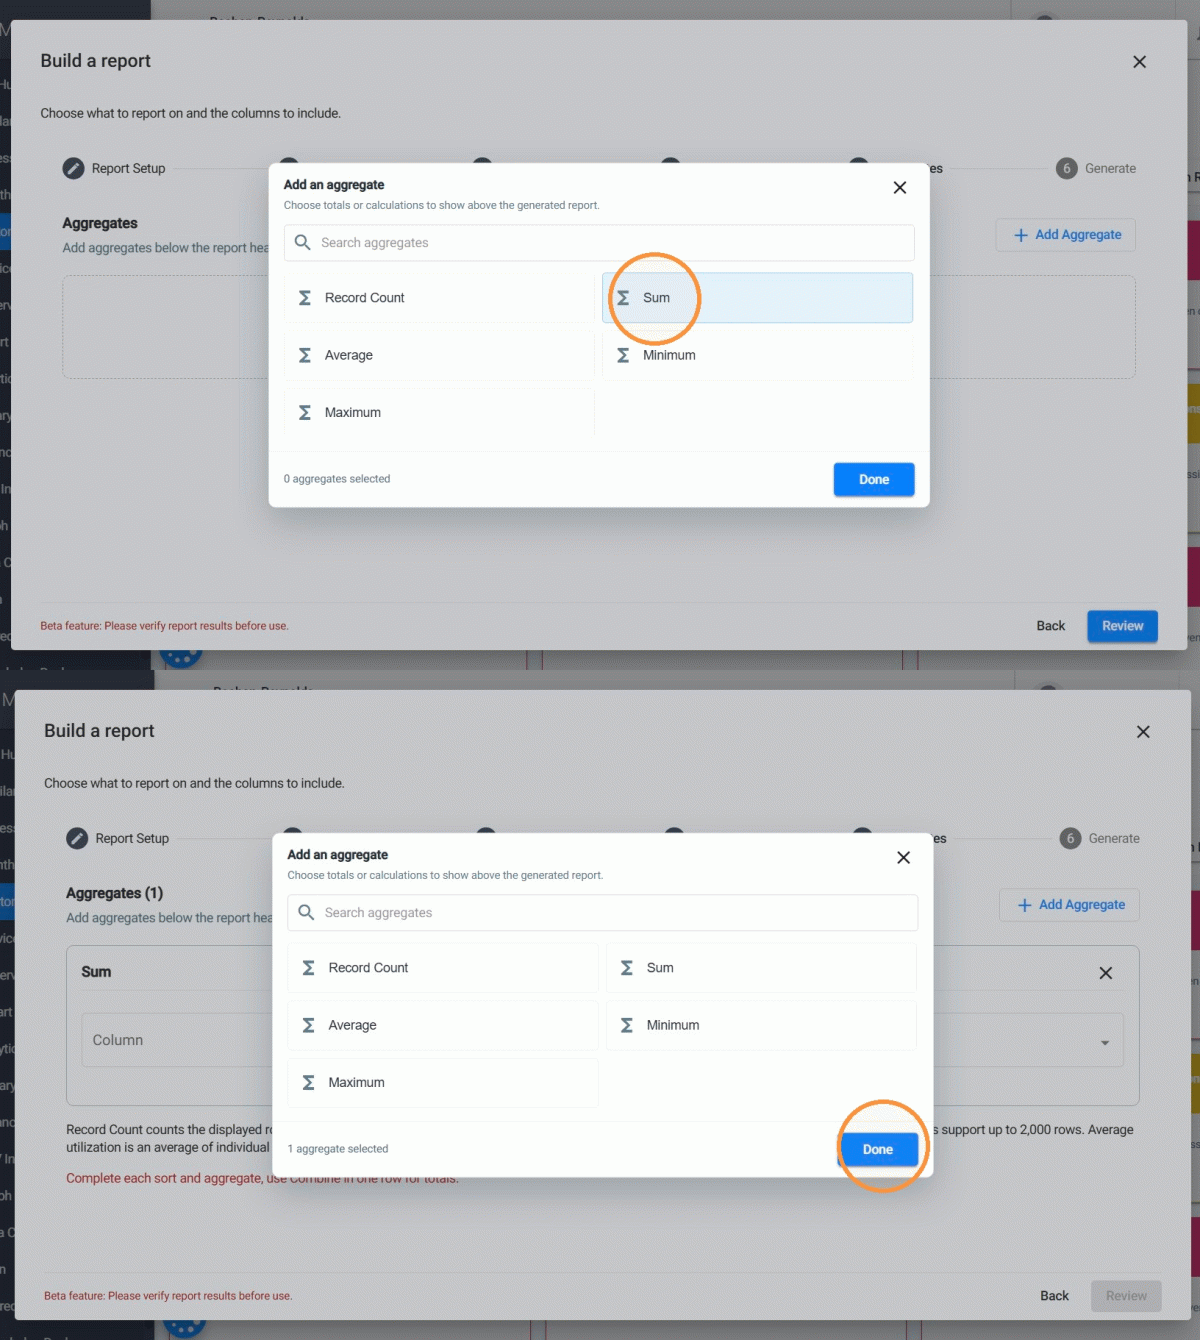
For this example, we can add two calculations to summarize our billed sessions that have not been paid by insurance:
- Record Count: To see how many sessions match our selected filters.
- Sum of Units: To calculate the total number of units associated with those sessions.
- To add the total units, we can select Sum and choose Units.
For example, if the report includes four sessions with 20, 20, 16, and 20 units, the aggregate would display a total of 76 units.
1.6 Review and generate your Report
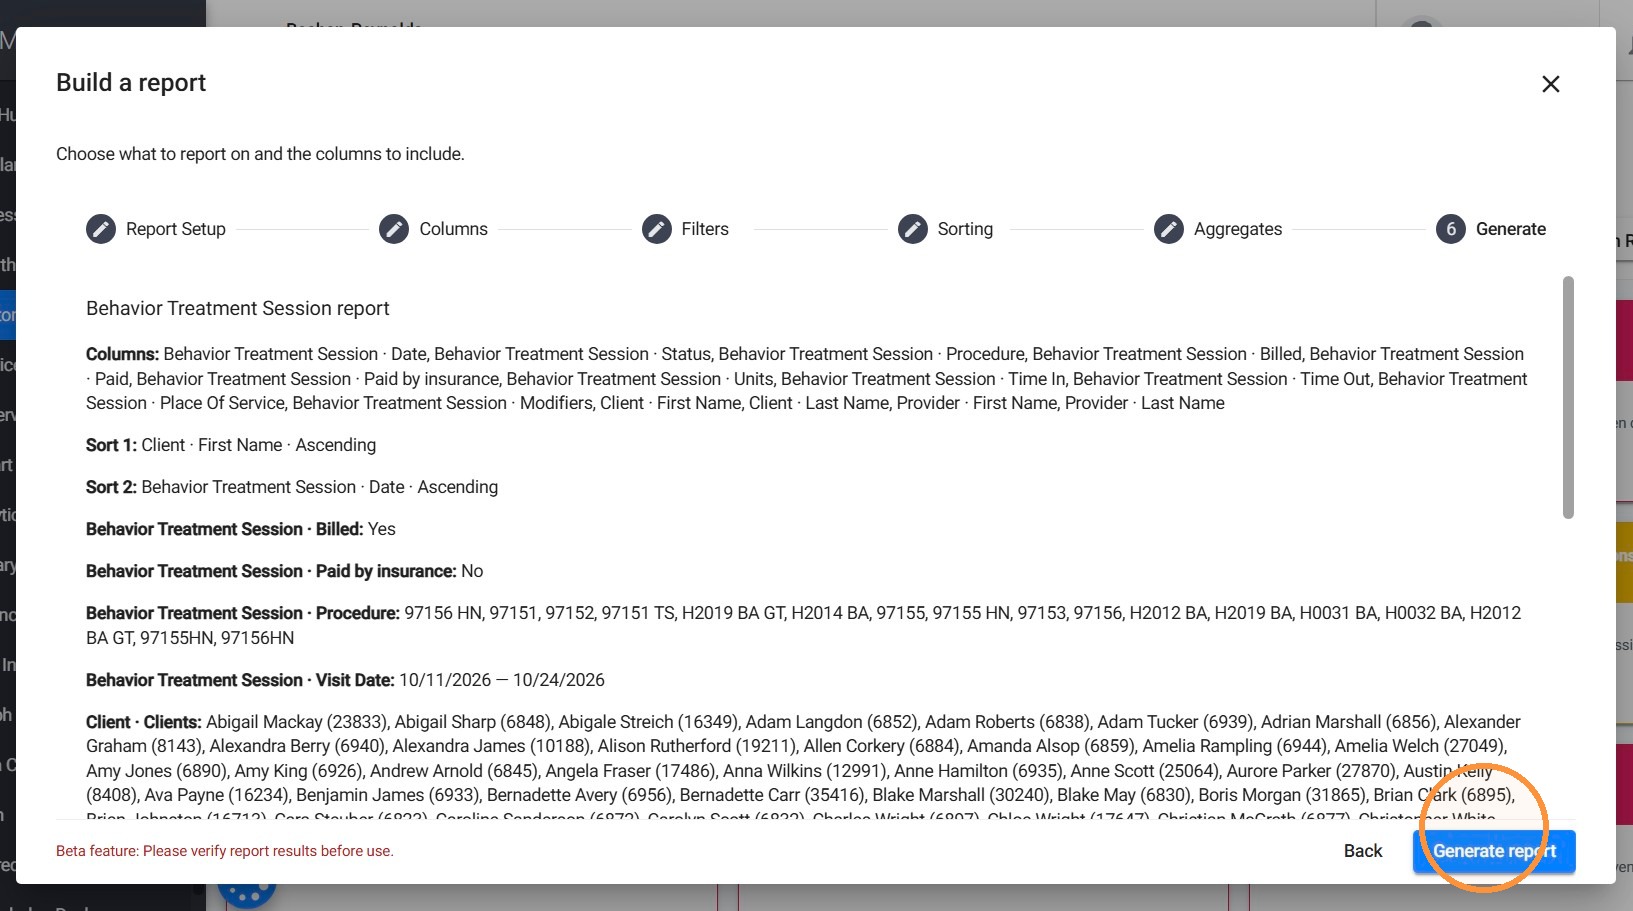
13. Before generating your report, ABA Matrix will display a summary of your selected configuration. Review your selections to make sure everything is correct. If you need to make changes, click Back to return to a previous step.
Once everything is ready, click Generate report.
2. Manage your Custom Report
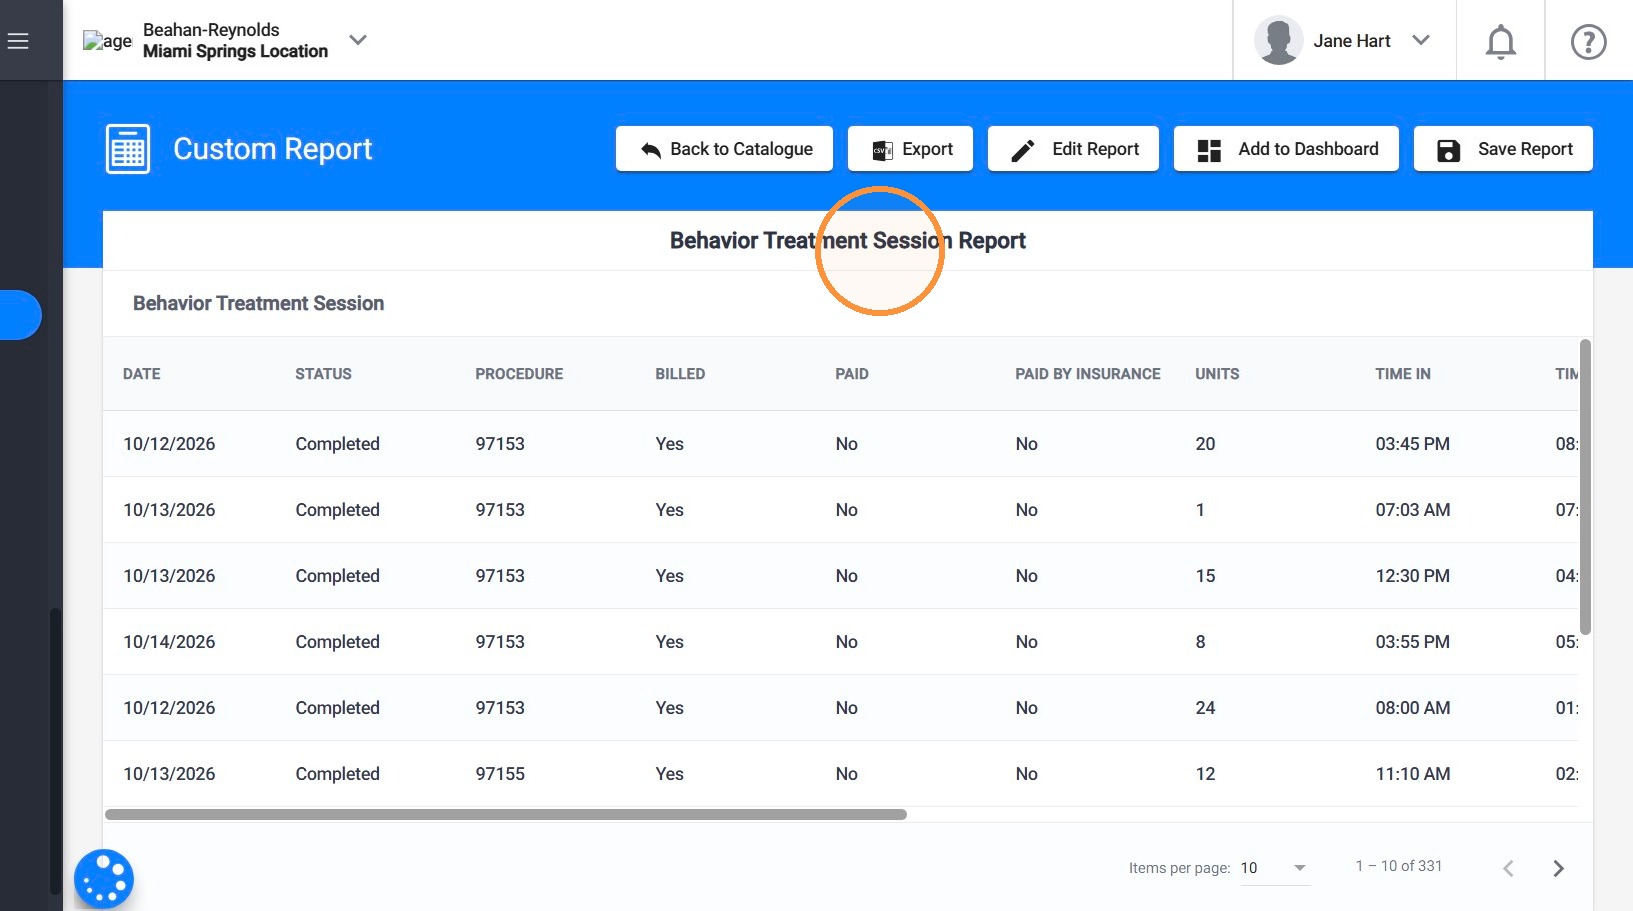
14. After generating your report, you will see several options that allow you to:
- Export your results,
- Edit the report configuration,
- Save it for future use, or
- Add it to your Dashboard for quick access.
2.1 Edit your Report
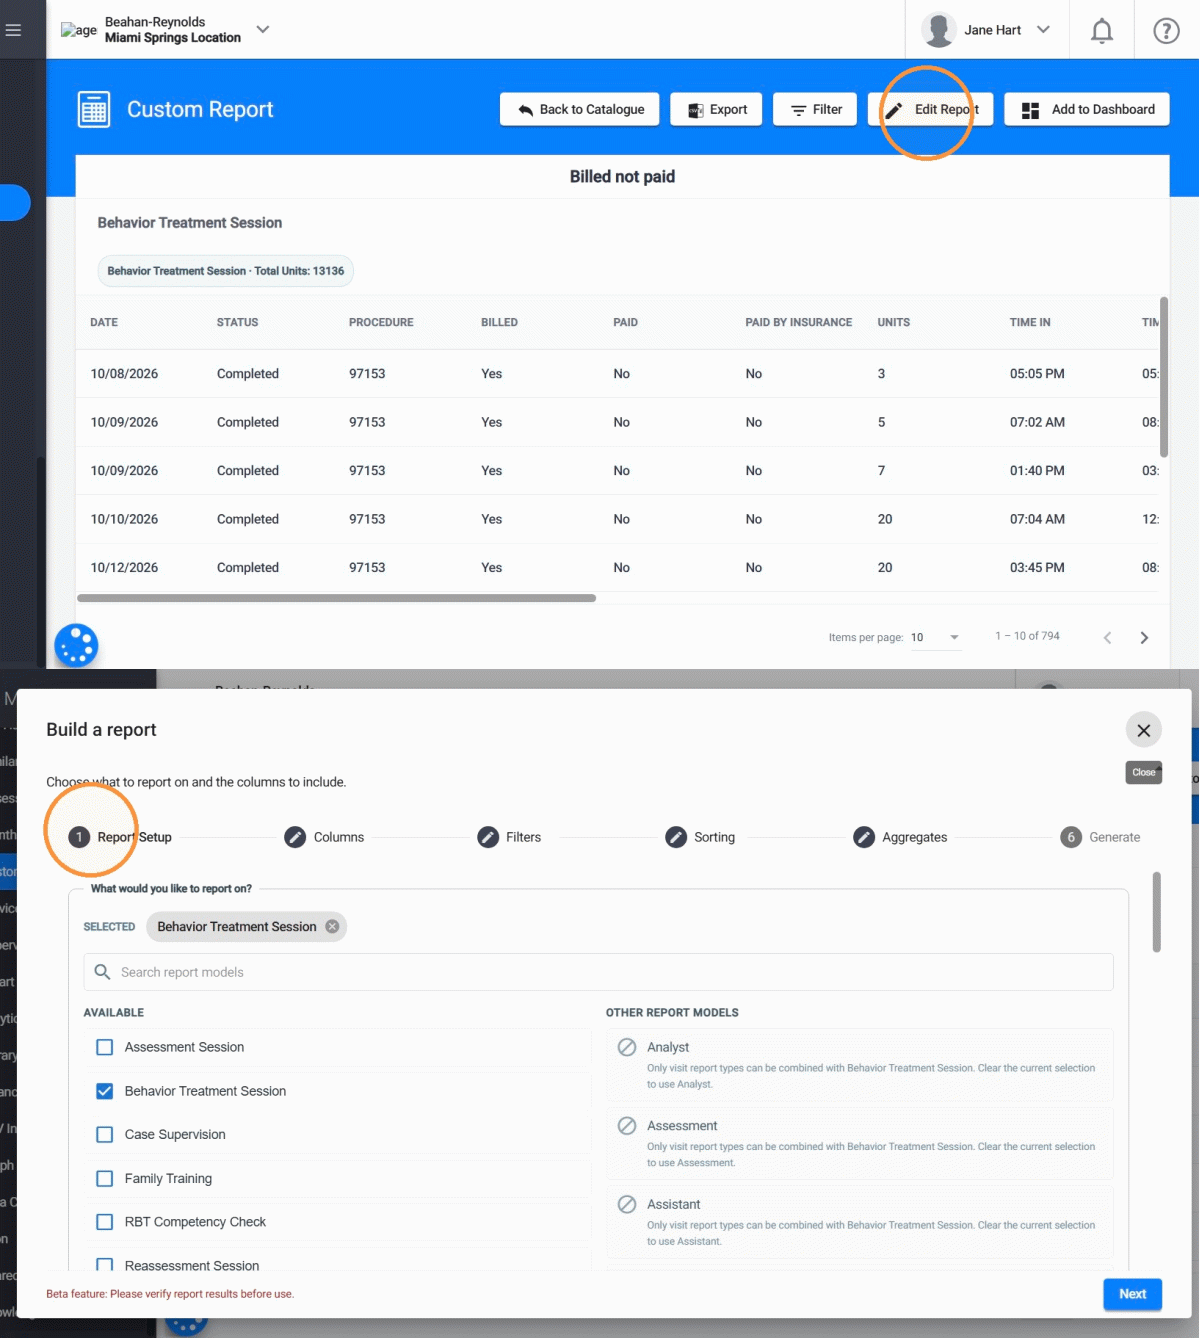
15. Click Edit Report to modify the information displayed in your report.
You can update the report type, columns, filters, sorting options, or aggregates and generate the report again to view the updated results.
2.2 Export your Report
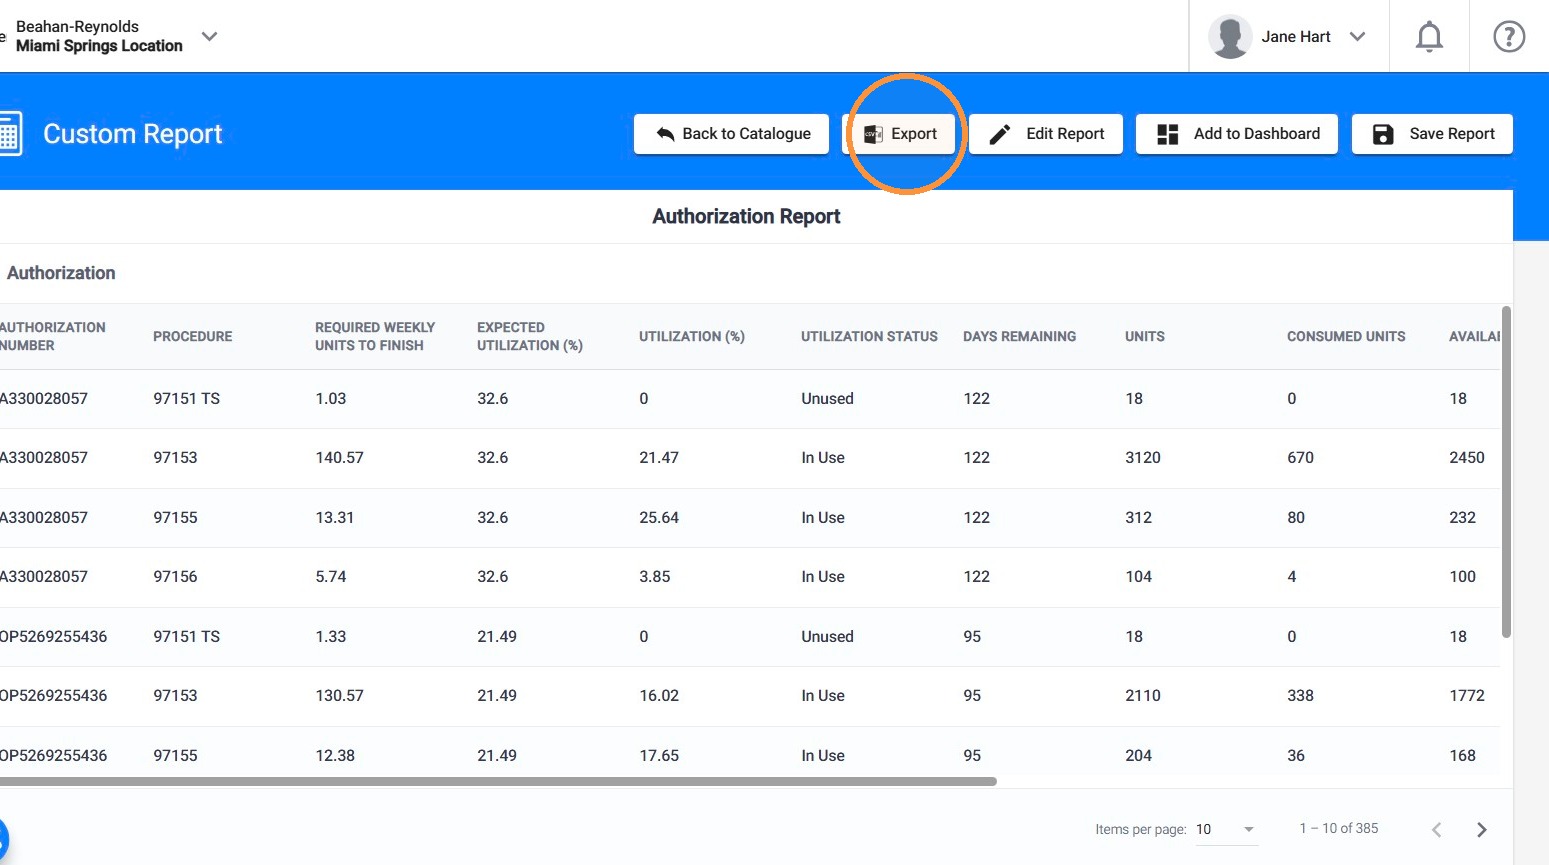
16. Click Export to download your report results as a CSV file.
You can open the file in Excel or another spreadsheet application to review, organize, or share the information.
2.3 Save your Report
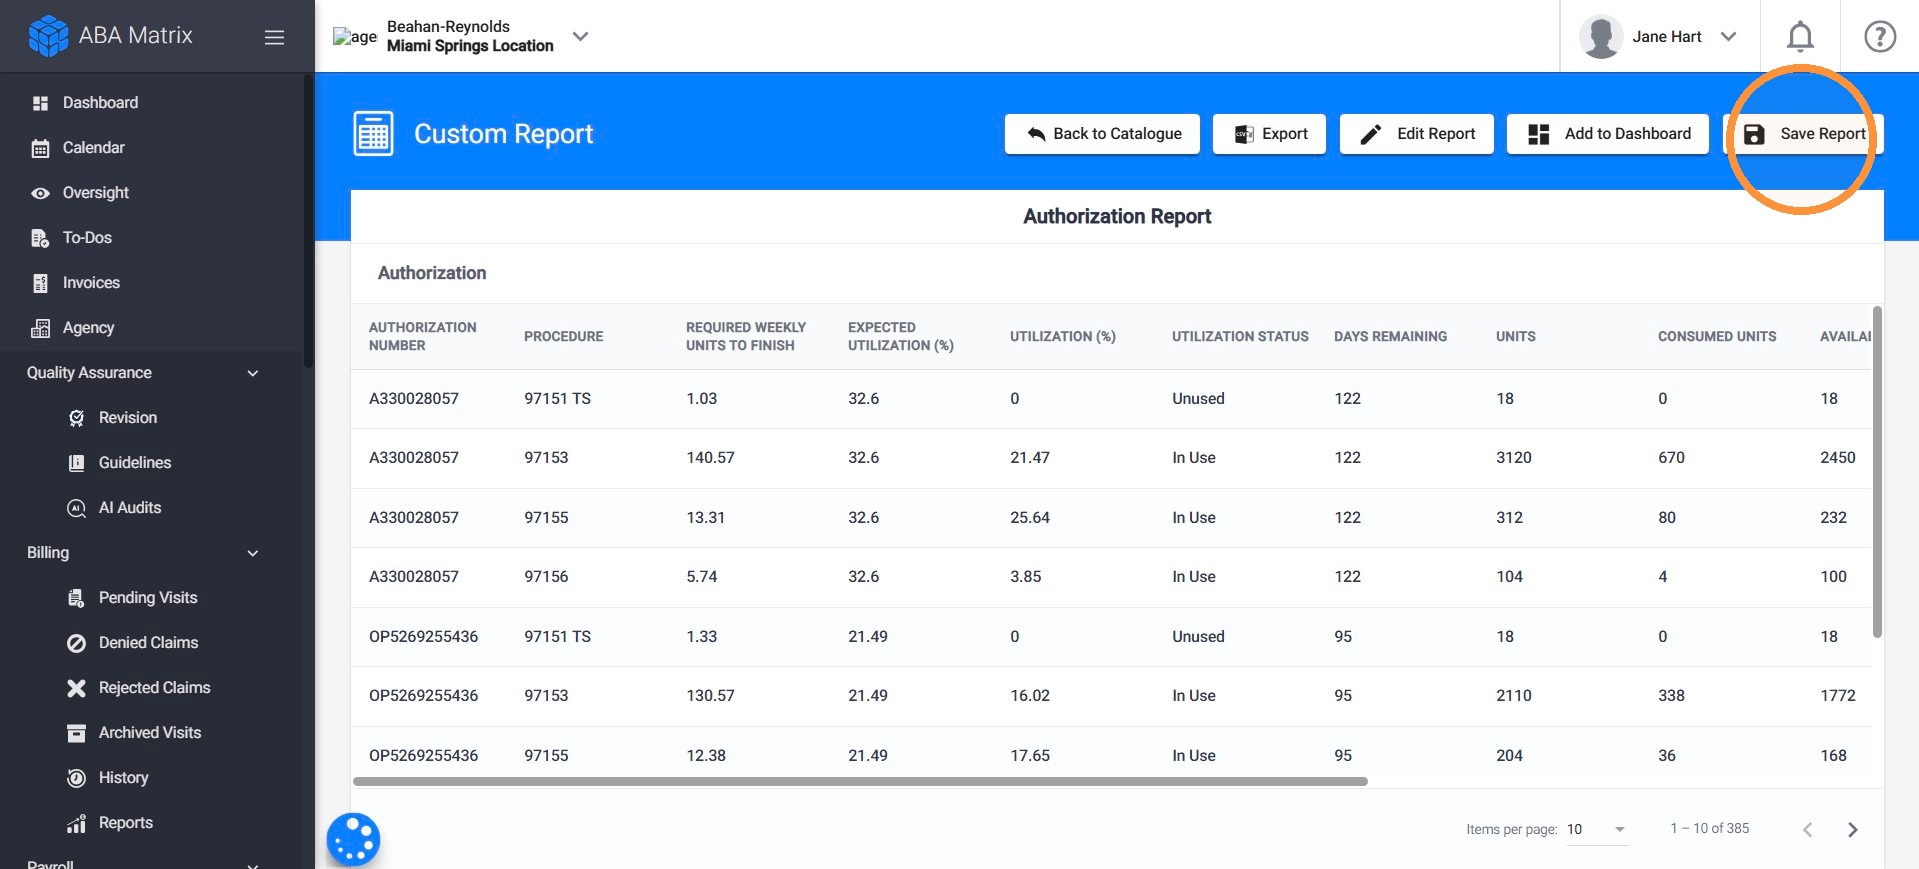
17. Click Save Report to save your report in the Custom Reports section, allowing you to access it again without recreating the configuration.
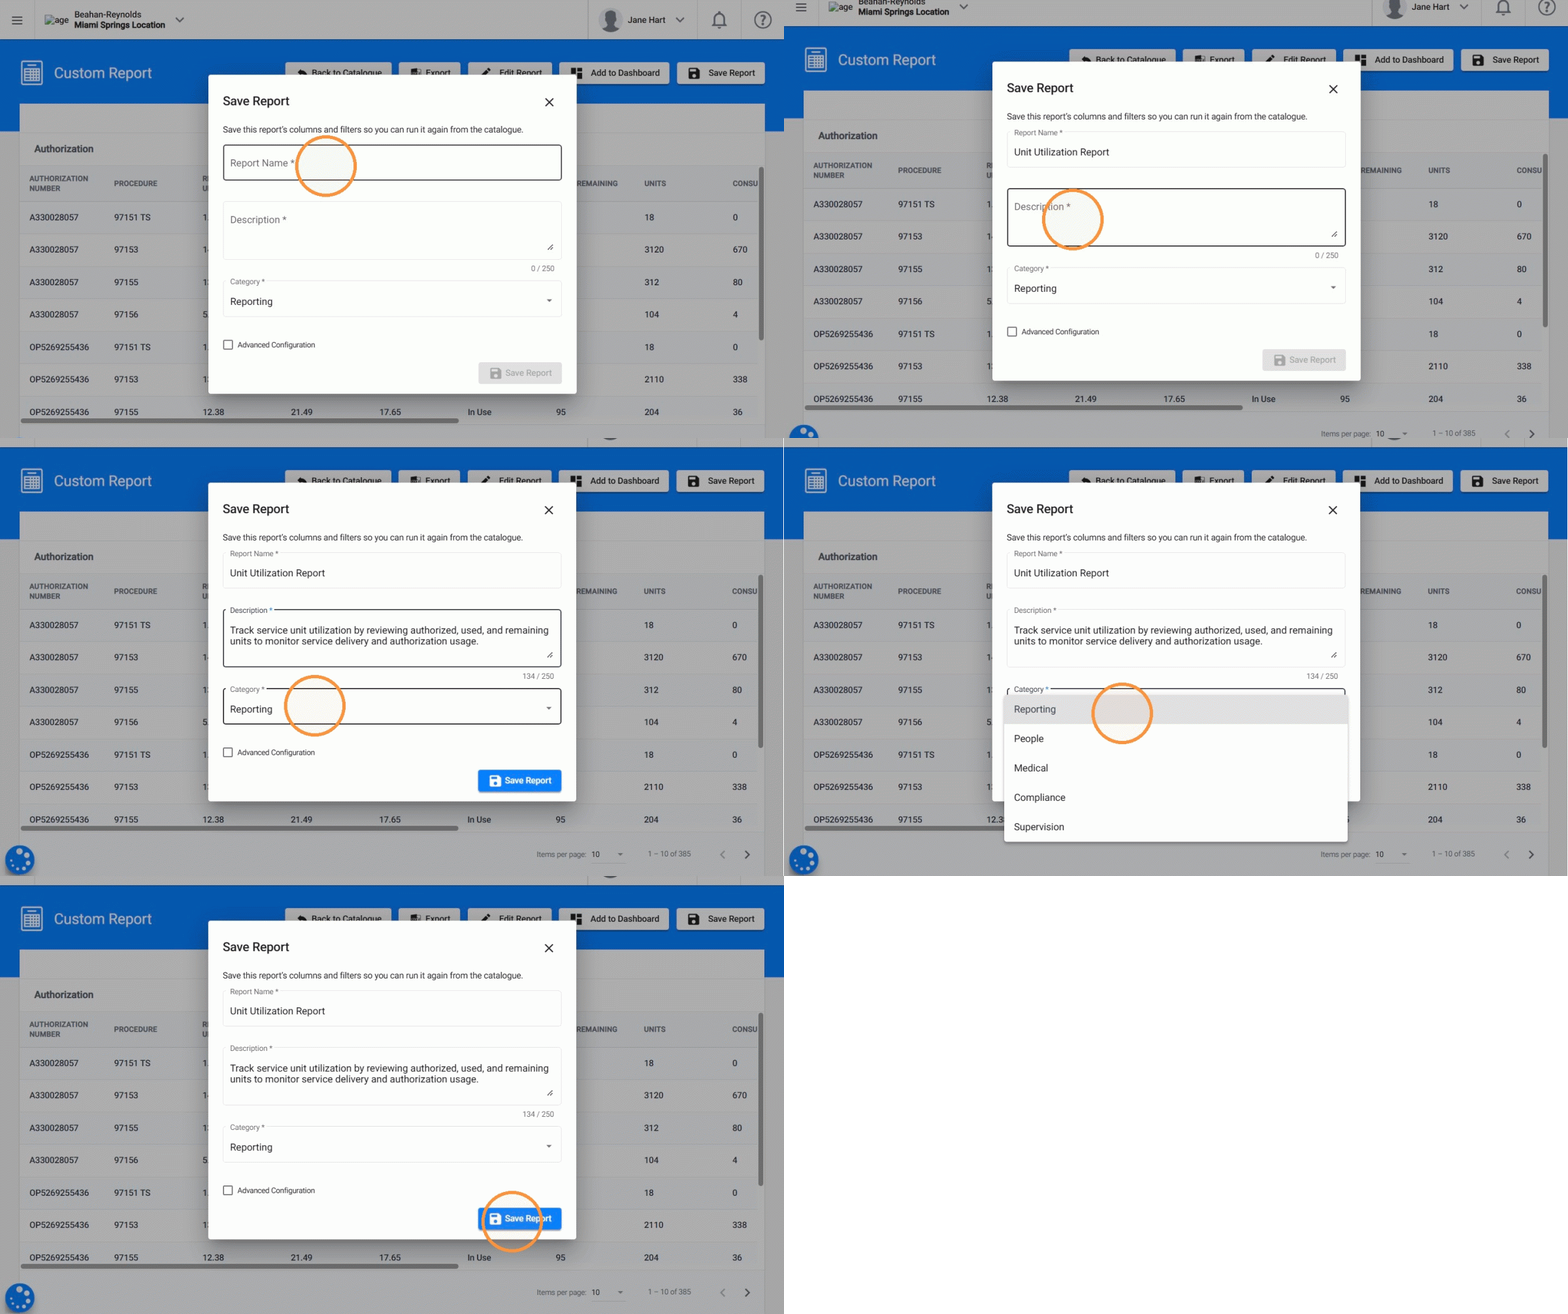
18. - Report Name: Enter a name to easily identify your report.
- Description: Add a brief explanation of the information included in the report.
- Category: Select the category where you want your report to appear.
2.4 Add your Report to the Dashboard
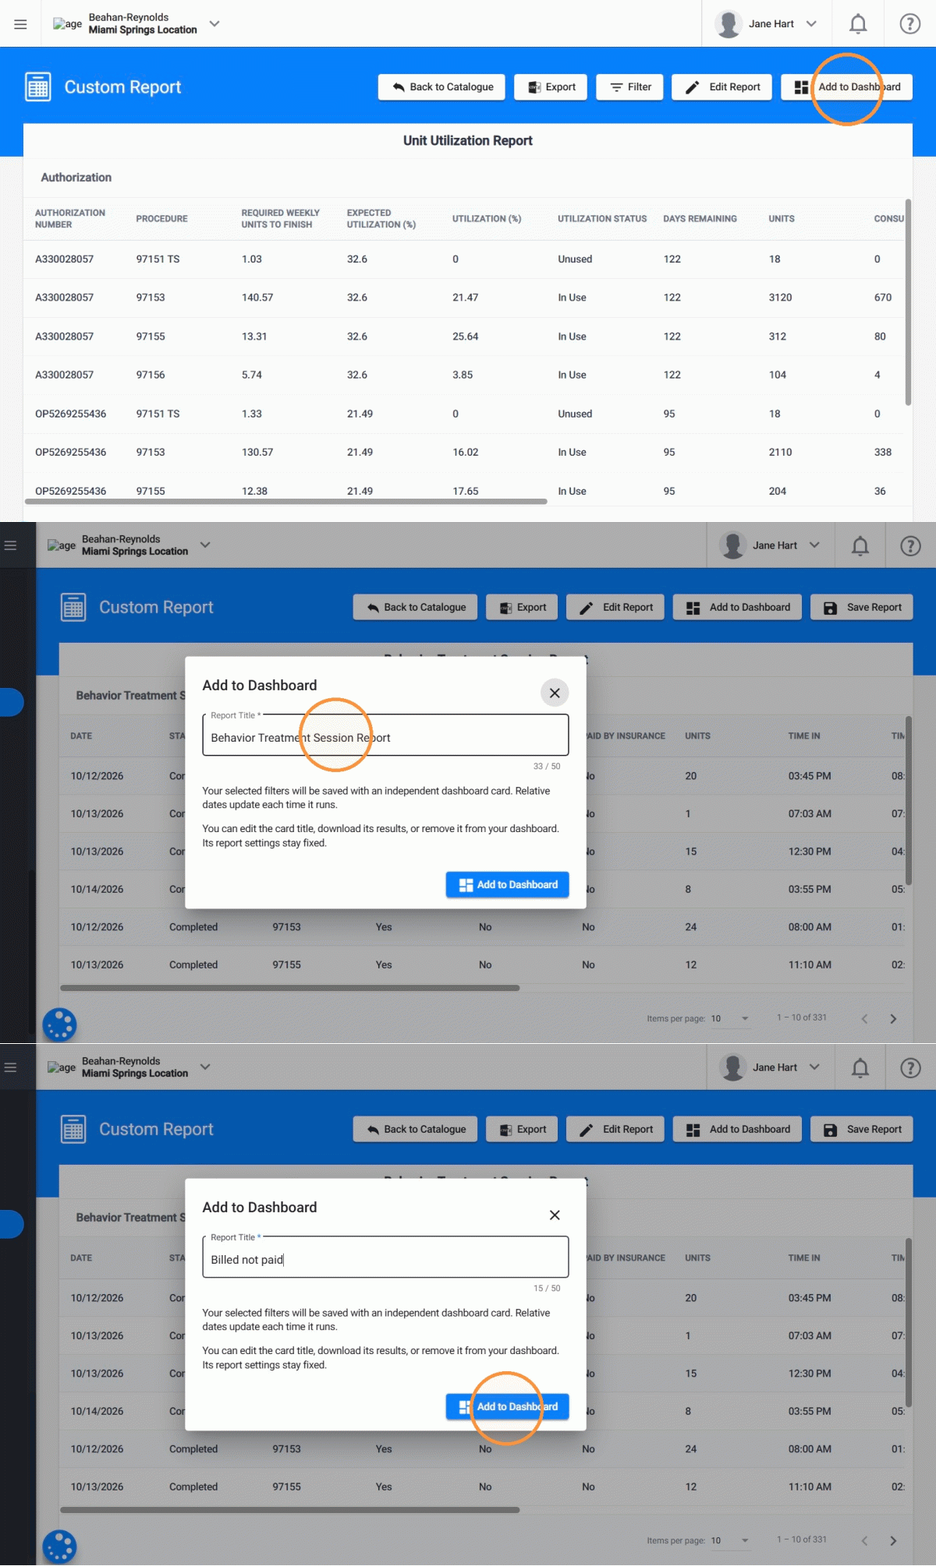
19. Click Add to Dashboard to display your custom report directly on your Dashboard for quick access.
- Enter a Report Title
- Click Add to Dashboard to confirm.
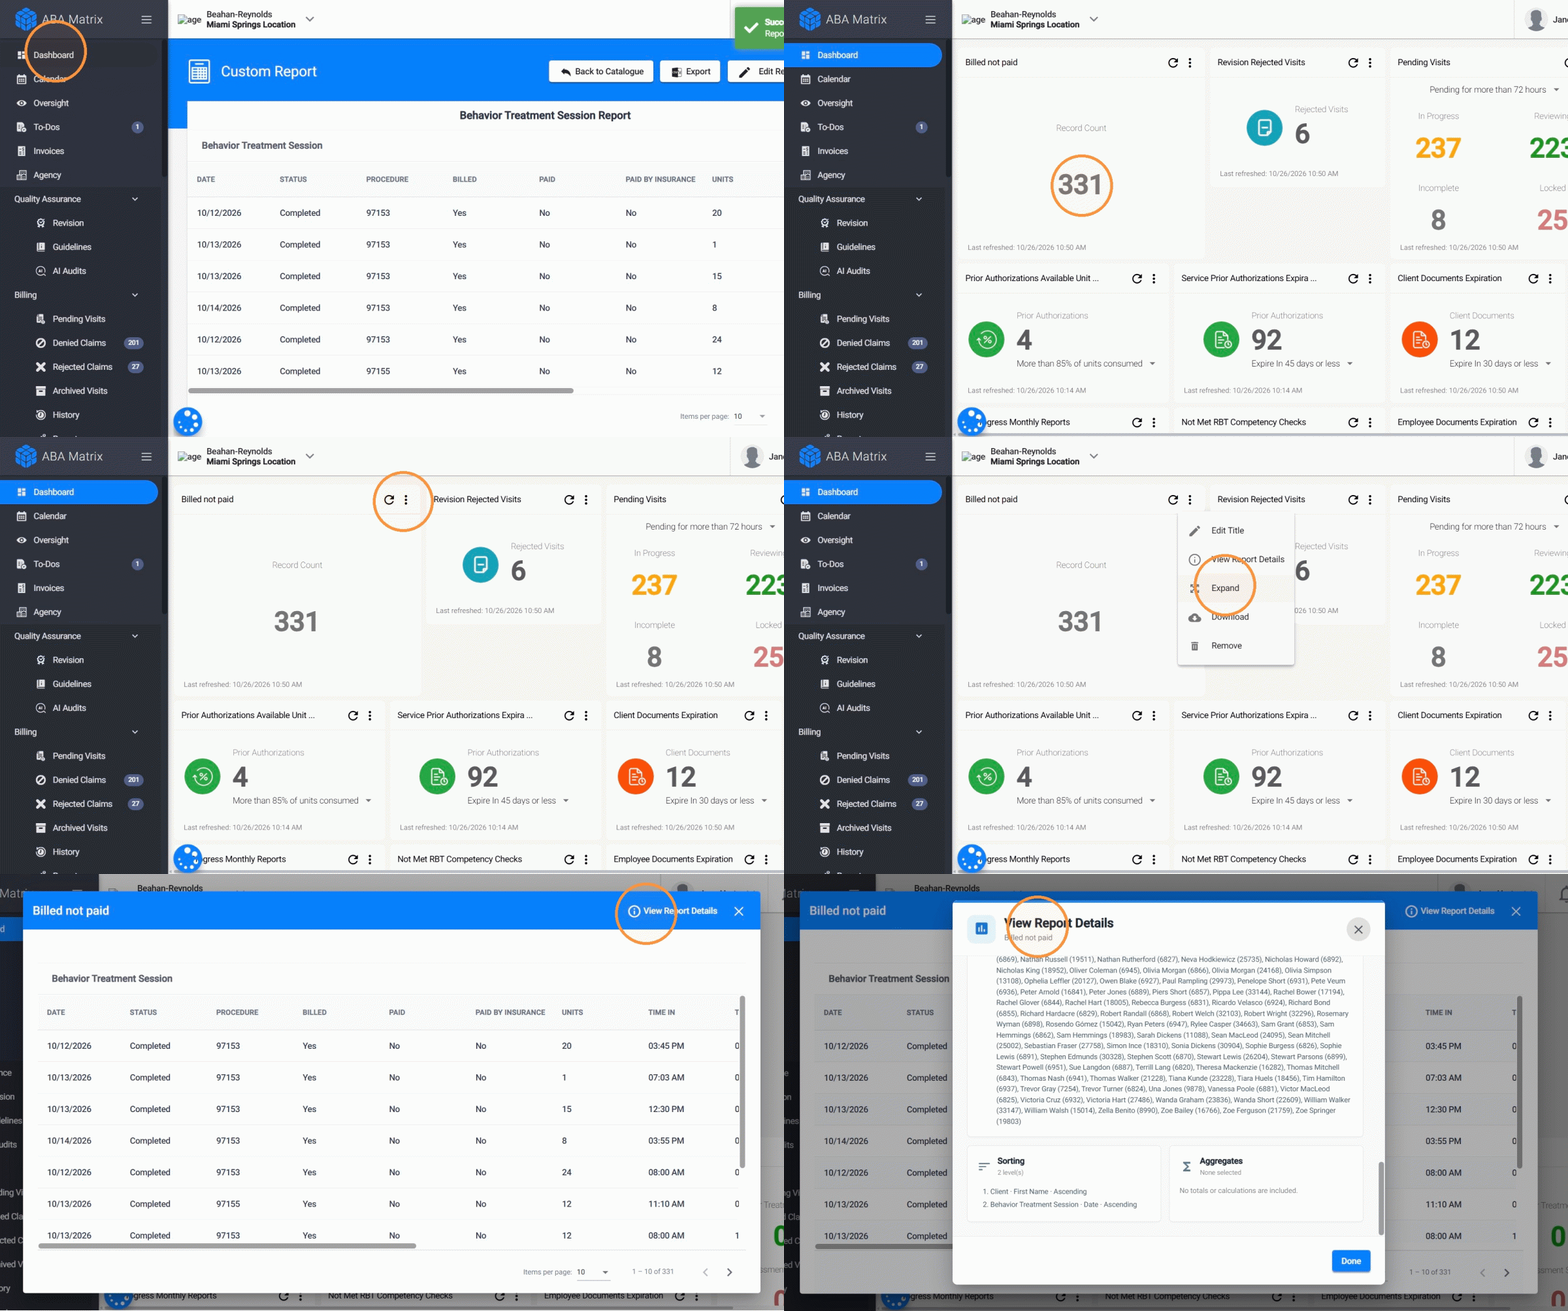
20. Once added to your Dashboard, the report will appear as a widget, allowing you to:
- View a summary of your report directly from the Dashboard.
- Download the complete report to review the results.
- Expand the widget to review the detailed report information.
2.5 Browse and Filter Reports in the Report Catalog
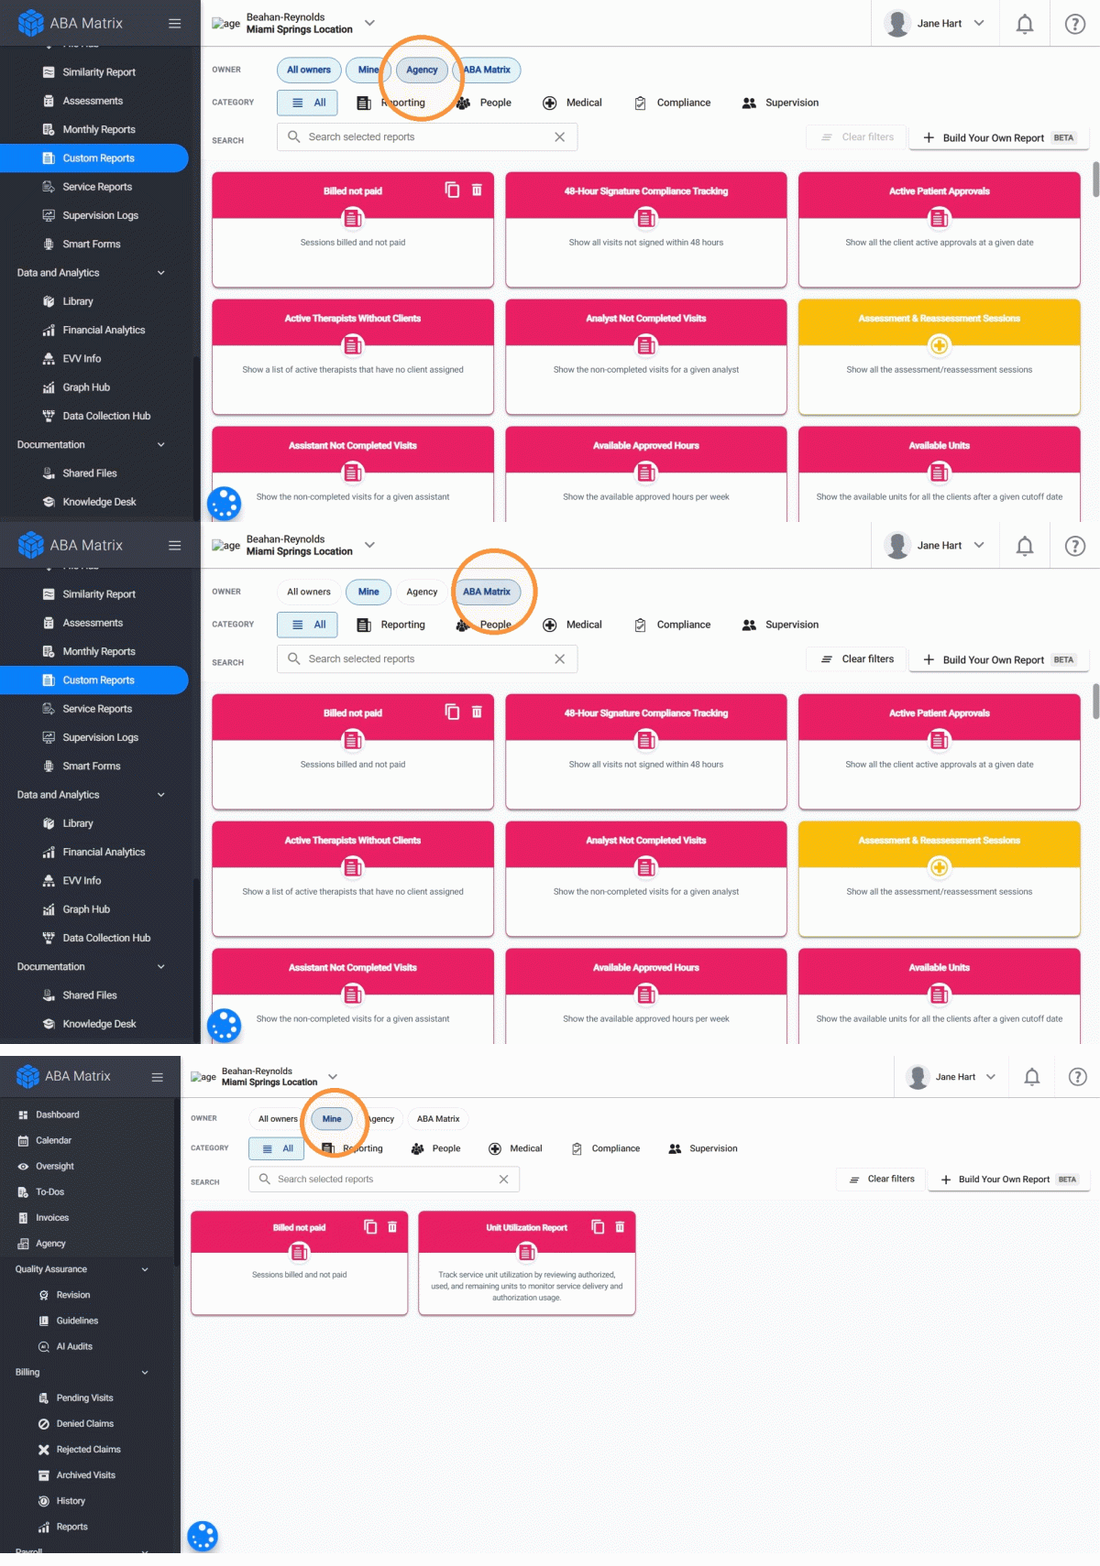
21. From the Report Catalog, you can browse reports by owner:
- ABA Matrix: Preconfigured reports available by default in the system.
- Agency: Custom reports created and shared within your agency.
- Mine: Custom reports you have created.
- All Owners: All available reports, regardless of who created them.
You can also filter reports by category or use the search bar to quickly find a specific report.
2.6 Copy and Customize an Existing Report
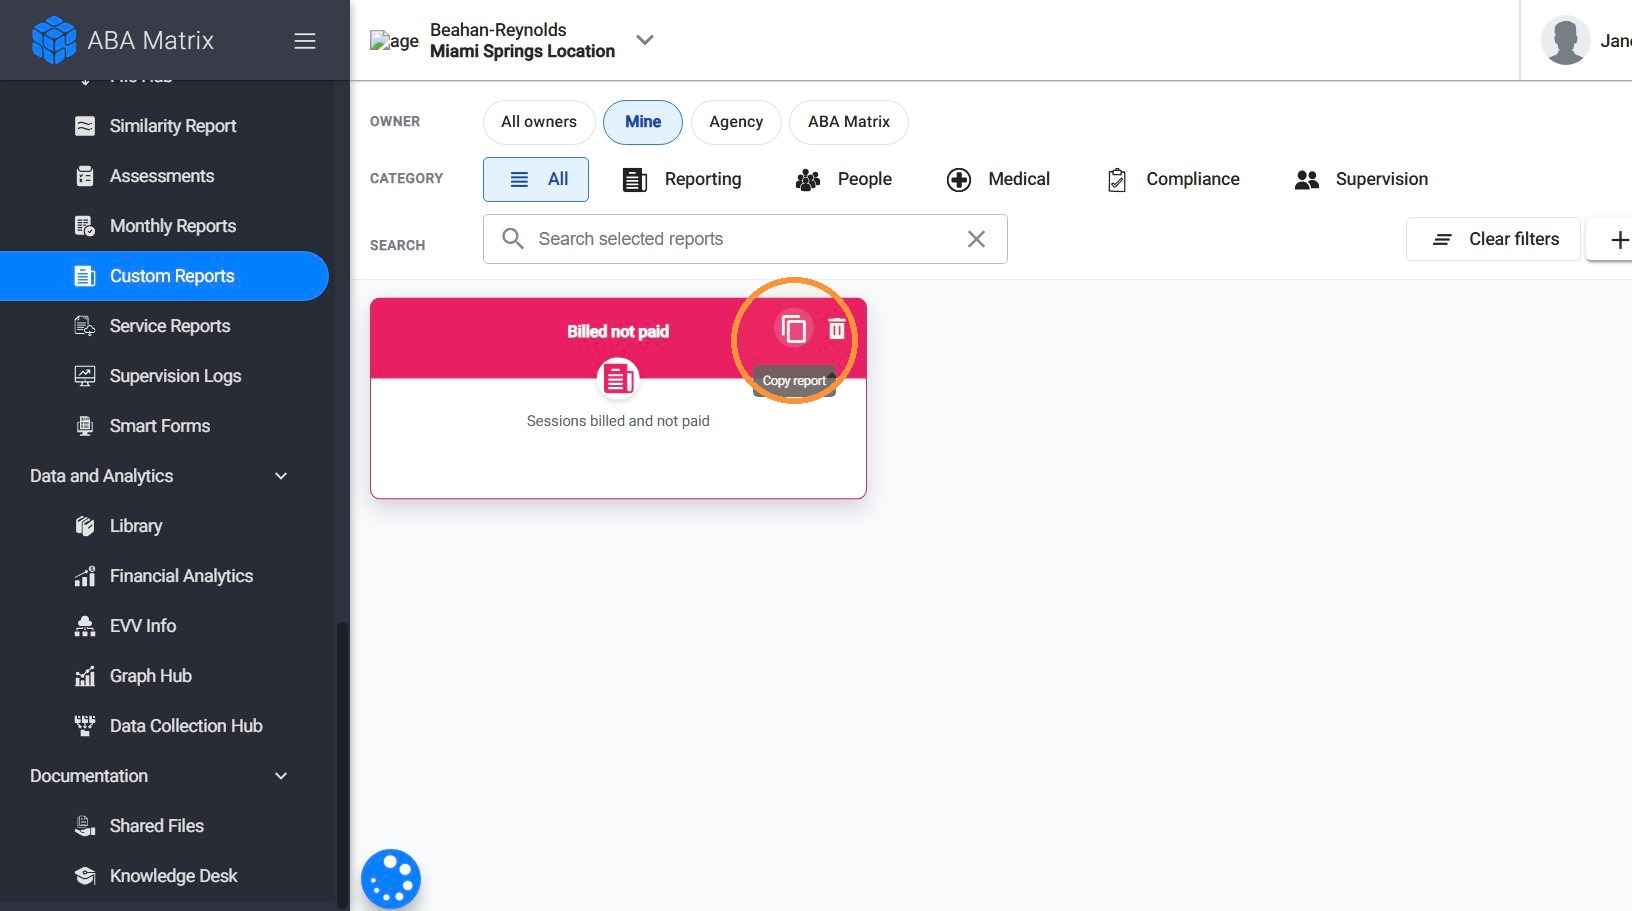
22. You can also copy an existing agency report to create your own version and customize the columns, filters, and other settings to display the information you need.