
How to use the Data Collection Tool in ABA Matrix
This guide provides step-by-step instructions on how to use a data collection tool efficiently. It allows users to easily filter and edit data for clients, view basic information and collected data, visualize data on a graph, track progress, and modify data as needed. It also provides information on obtaining necessary permissions for data editing.
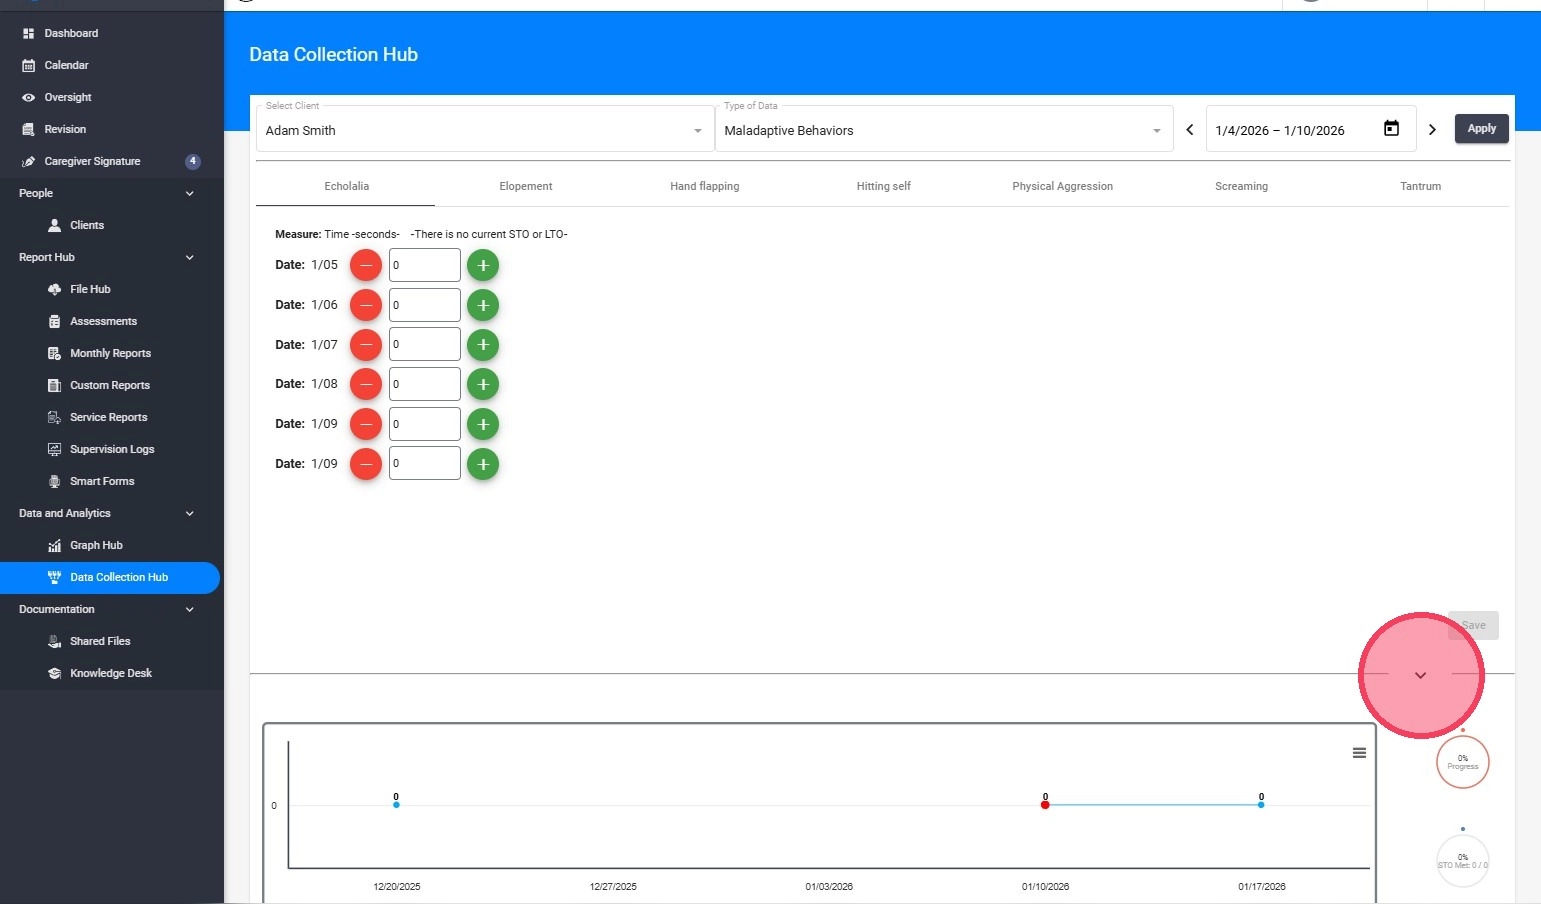
1. Access the Data Collection Hub
You will be able to edit the data collection of your clients more efficiently from the data collection hub
1. To access the Data Collection Hub, there are two ways to do it:
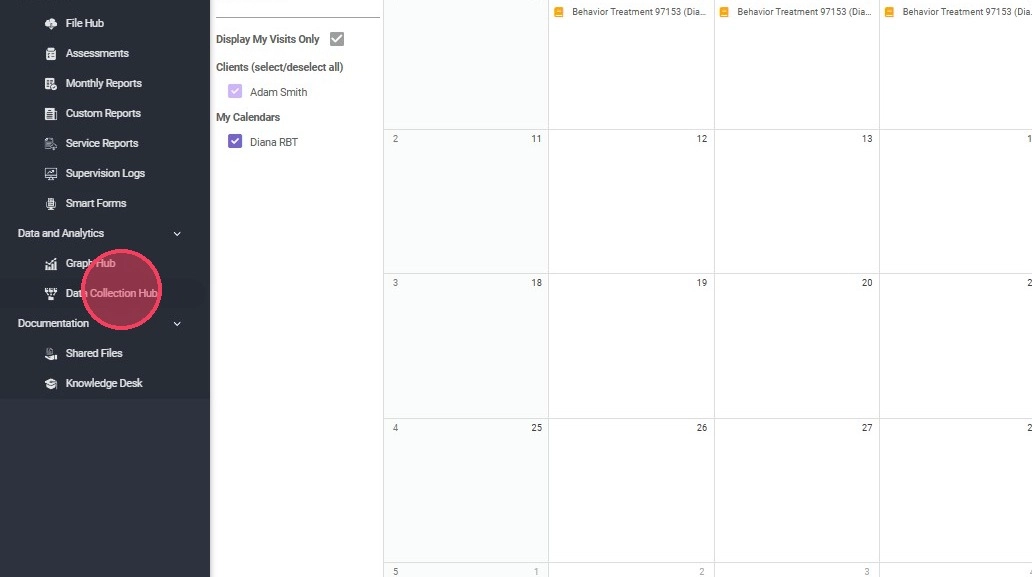
1) From the index panel located on the right side of the window.
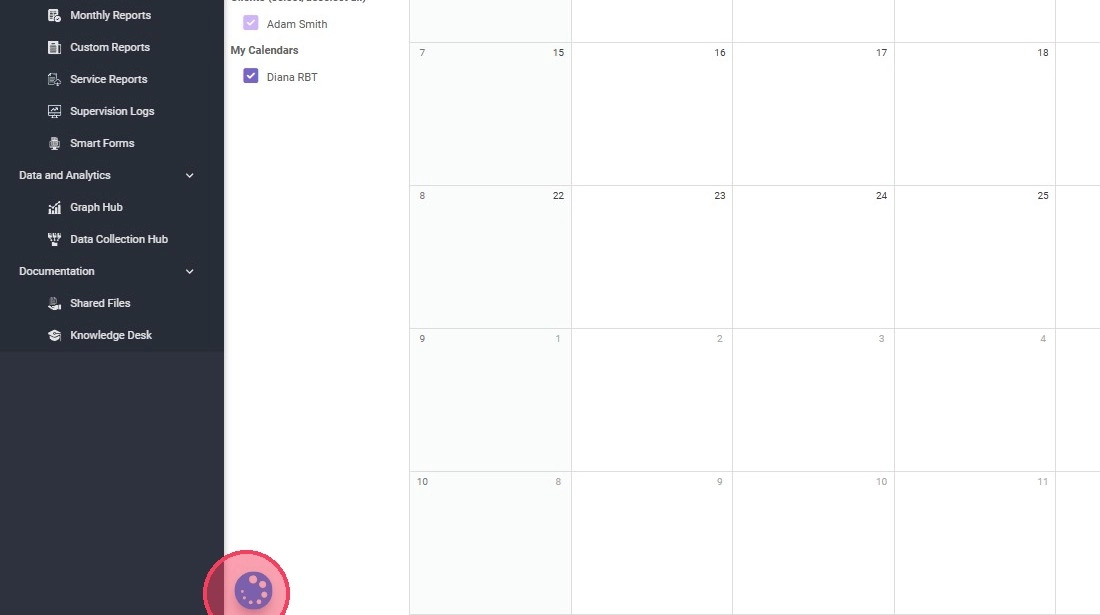
2. 2) Or from the blue, round tool icon at the bottom of the page.
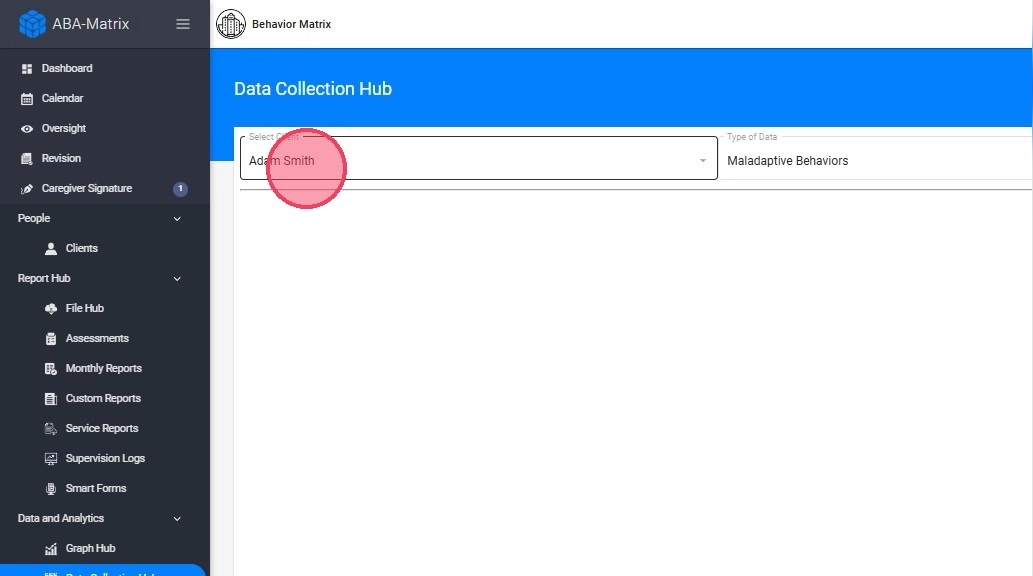
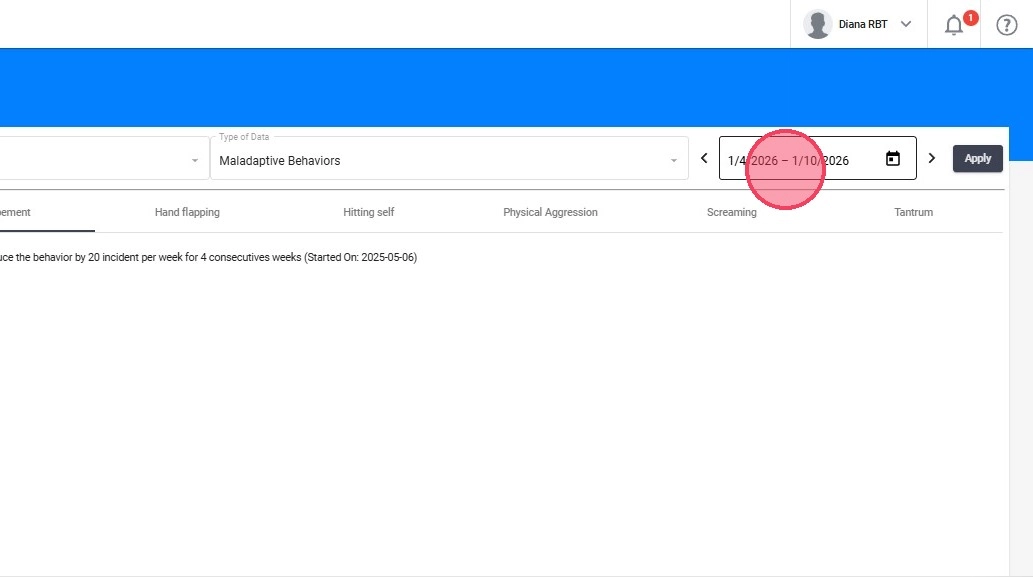
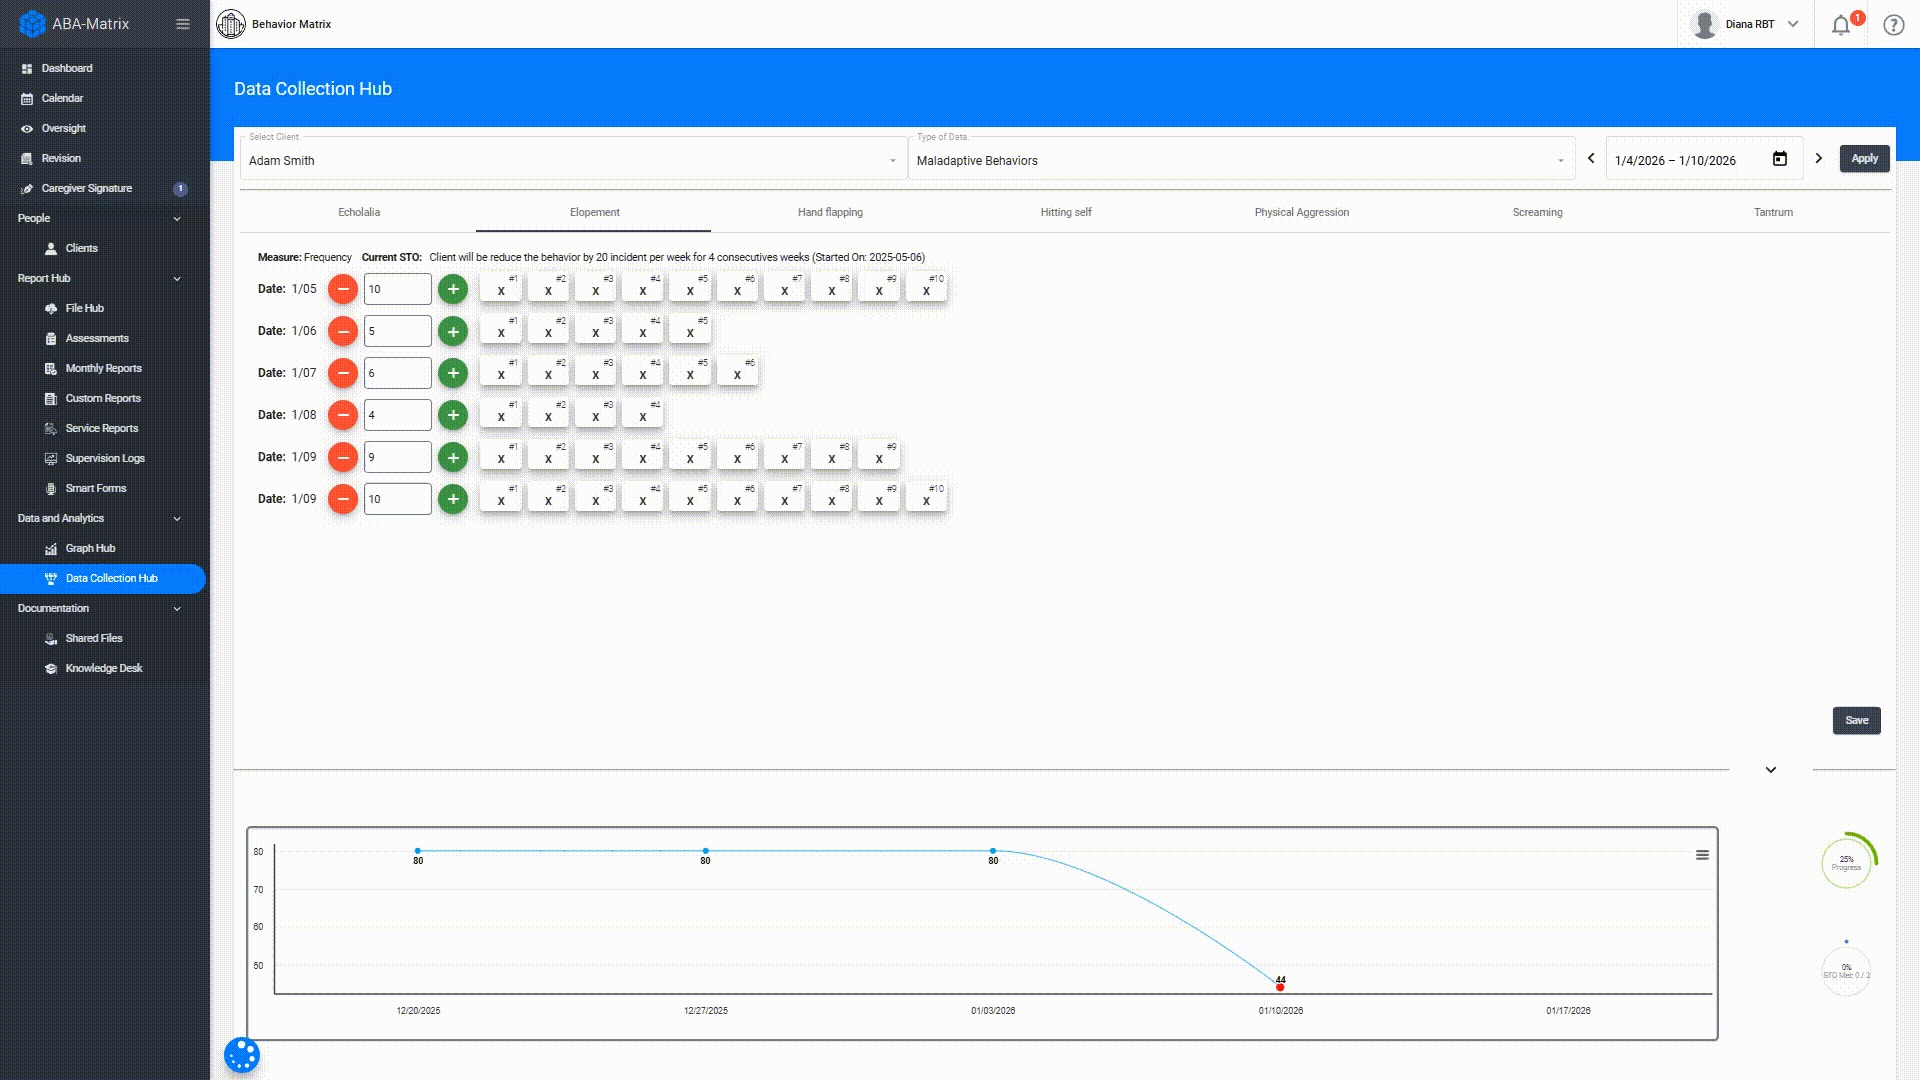
3. You only have to filter by the client you want, the type of graph (Maladaptive Behaviors, Replacement Behaviors or Skill Acquisitions) and date:
2. Data Collection Hub View
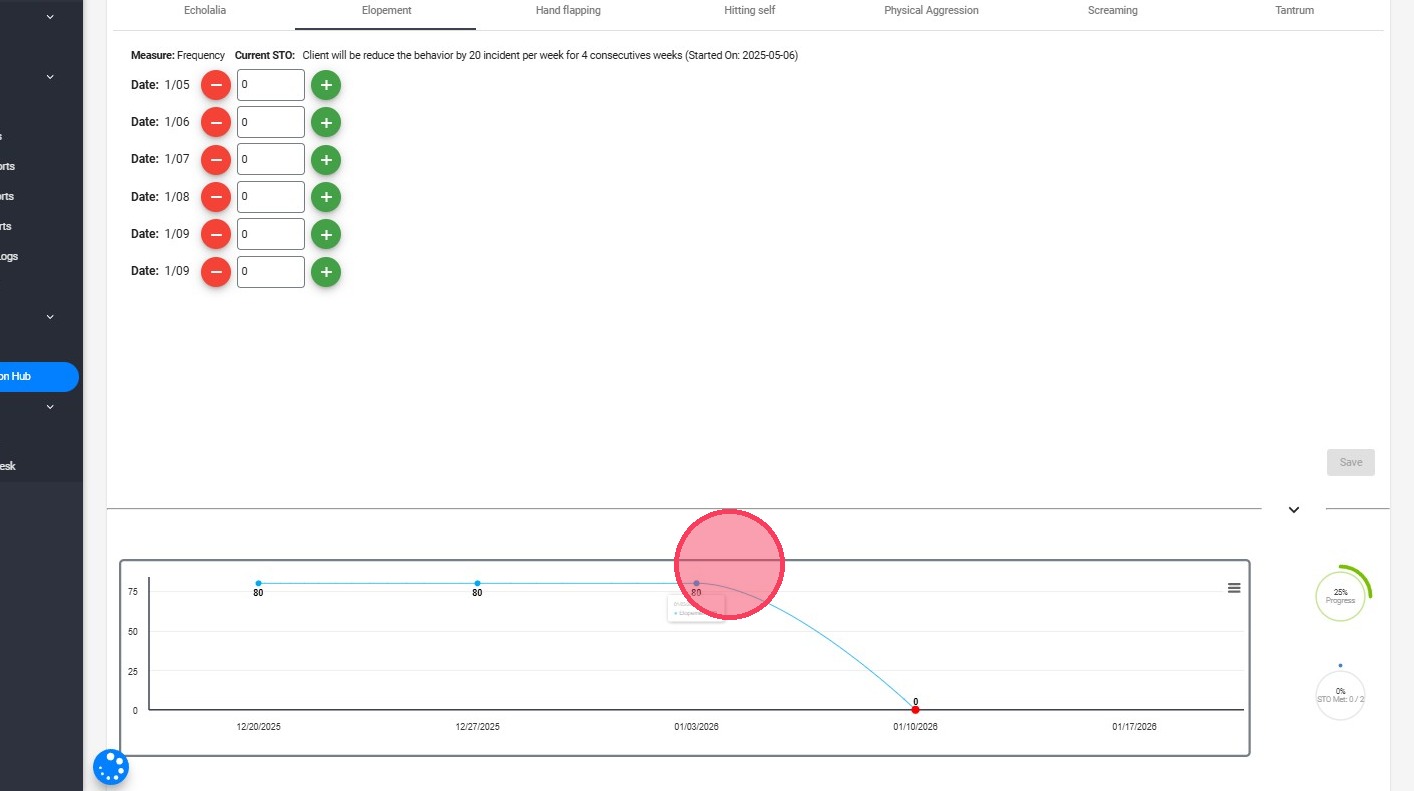
4. You can see basic information of the behavior, replacement or skill selected:
- Measure: Measure of the behavior, replacement or skill selected
- Current STO: Current STO, with start date
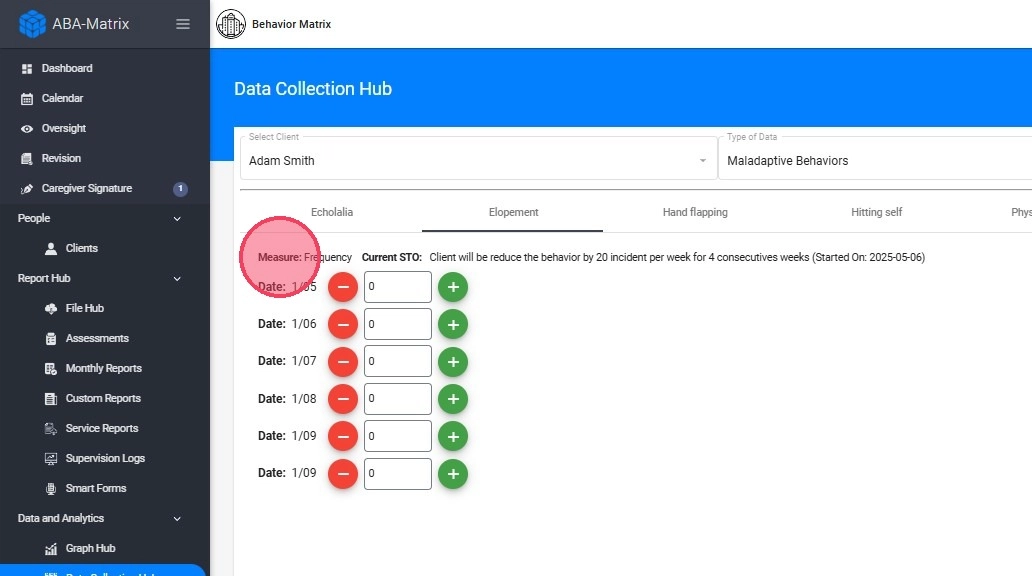
5. Data collected in the selected week:
You can see all the days when you collected data within the selected week, and the values of each one.
6. Graphic representation:
The week that was filtered to show data will be represented on the graph with a red dot.
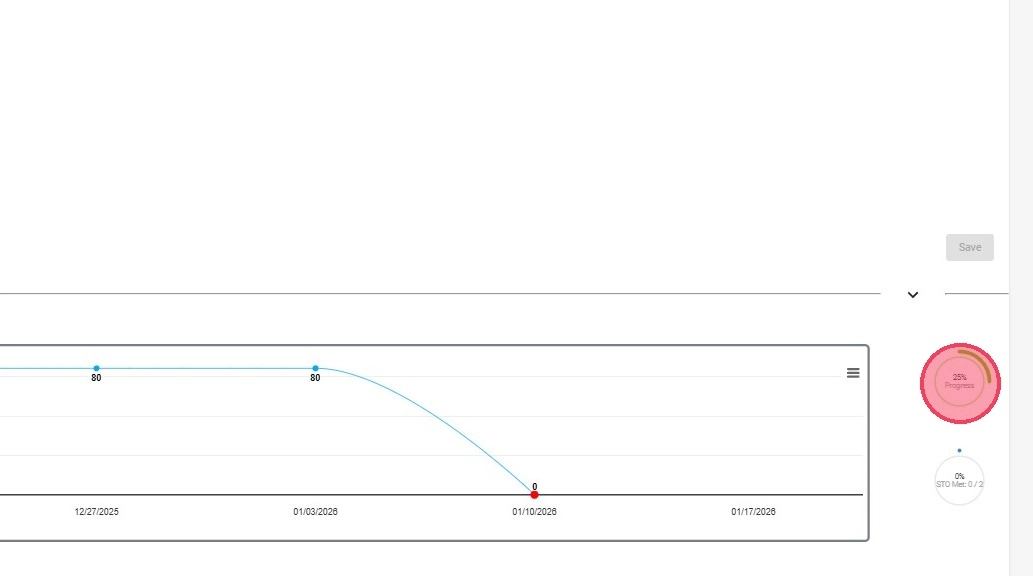
7. Progress
- Progress: % progress
- STO Met: Number of STOs that have been met out of the total
8. You can also hide the graph to give yourself more screen space for reviewing session dates and entering data.
3. Modify the data collection
9. If you want to modify data on any of these days, you can do so as you normally would within a note:
Remember to save the changes before exiting the tool.
4. Permissions
If you do not have access to edit data for a specific client or date, please contact the administration of your agency, as they can grant you the required permissions.